Fig. 6
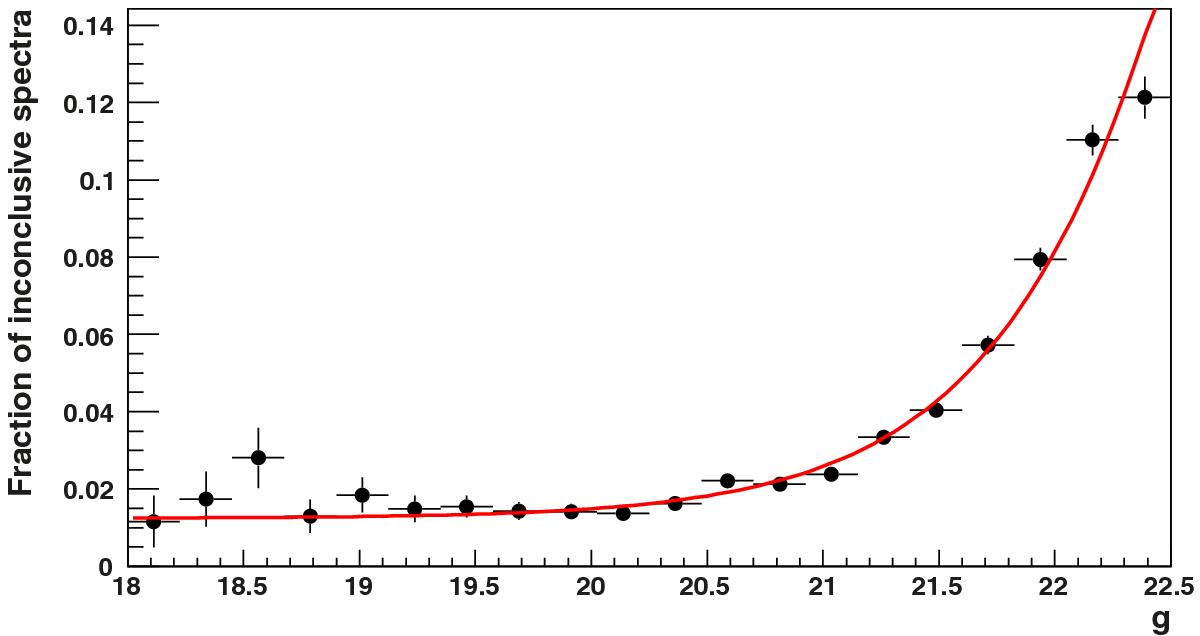
Fraction of inconclusive spectra (i.e., 1−ϵspect(g)) as a function of observed g magnitude. The curve is an empirical fit to the data by a hyperbolic tangent. The ~1% loss at bright magnitudes is an artifact of the current pipeline. The increase at faint magnitudes is compatible with previous estimates.
Current usage metrics show cumulative count of Article Views (full-text article views including HTML views, PDF and ePub downloads, according to the available data) and Abstracts Views on Vision4Press platform.
Data correspond to usage on the plateform after 2015. The current usage metrics is available 48-96 hours after online publication and is updated daily on week days.
Initial download of the metrics may take a while.