Fig. 12
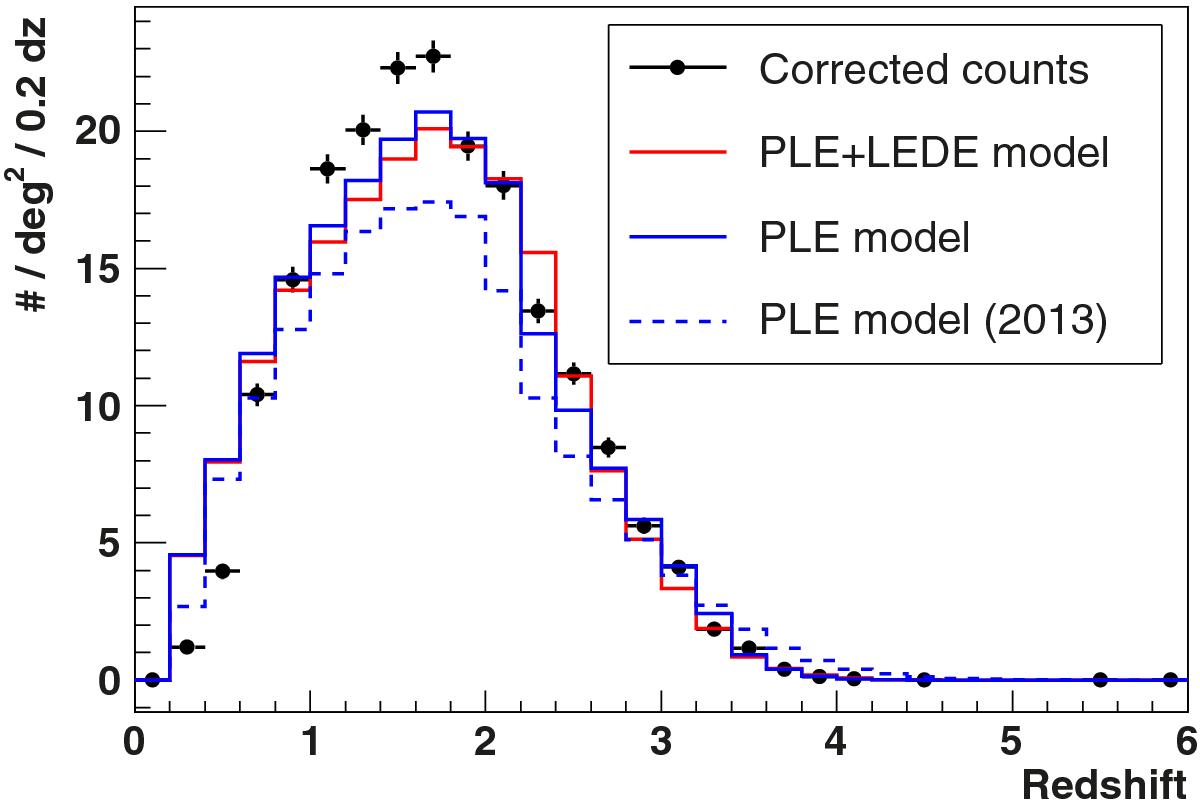
Projected counts for gc< 22.5 for the PLE (blue) and the PLE+LEDE (red) luminosity function models used to fit the binned QLF. The dashed curve is the best-fit model of Paper LF, shown here for comparison. Our new fits indicate a ~10% increase in total quasar counts.
Current usage metrics show cumulative count of Article Views (full-text article views including HTML views, PDF and ePub downloads, according to the available data) and Abstracts Views on Vision4Press platform.
Data correspond to usage on the plateform after 2015. The current usage metrics is available 48-96 hours after online publication and is updated daily on week days.
Initial download of the metrics may take a while.