Fig. 10
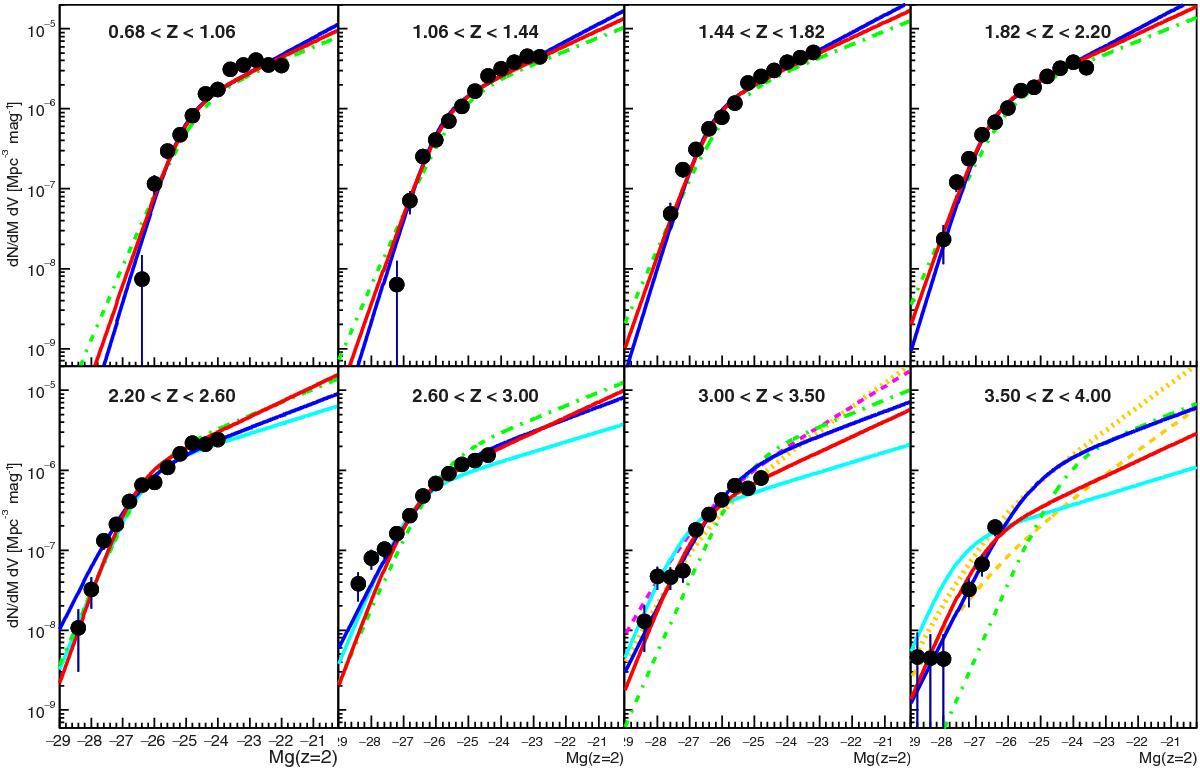
Quasar luminosity function measurements (black circles). The best-fit models of this work are shown as the red (respectively blue) curves for the PLE+LEDE (resp. PLE) models. The green dot-dashed curve is the LF of Croom et al. (2009). The plain cyan curve is the best fit LEDE model of Ross et al. (2013) at z> 2.2. The orange dotted and dashed curves are the best fits to COSMOS data (Masters et al. 2012) at z ~ 3.2 (shown in the last two redshift bins) and z ~ 4.0, respectively. The magenta dashed curve (almost exactly overlapping the orange dotted curve at the faint end in the 3.0 <z< 3.5 redshift bin) is measured at z ~ 3.2 from SWIRE and SDSS (Siana et al. 2008).
Current usage metrics show cumulative count of Article Views (full-text article views including HTML views, PDF and ePub downloads, according to the available data) and Abstracts Views on Vision4Press platform.
Data correspond to usage on the plateform after 2015. The current usage metrics is available 48-96 hours after online publication and is updated daily on week days.
Initial download of the metrics may take a while.