Fig. 5
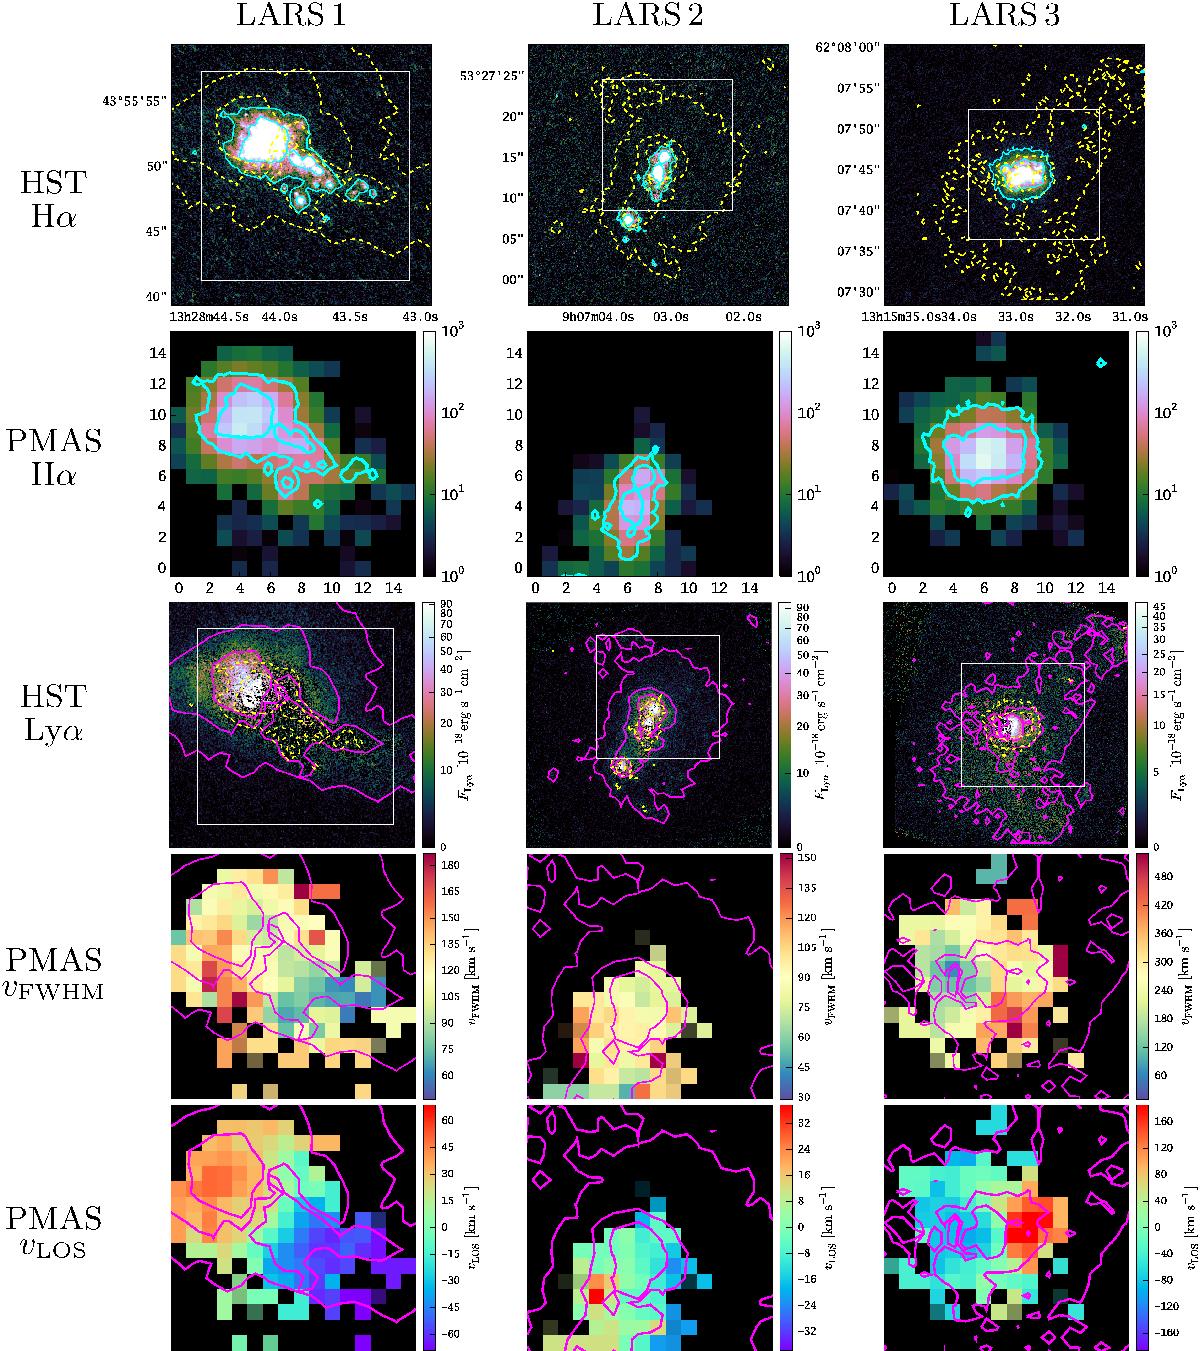
Comparison of LARS HST imaging results of the LARS sample to spatially resolved PMAS Hα spectroscopy. North is always up and east is always to the left. For each galaxy from top to bottom: the first panel shows the LaXs Hα line intensity map; tick labels indicate right ascension and declination and an asinh-scaling is used cut at 95% of the maximum value. The second panel shows a S/N map of the continuum-subtracted Hα signal observed with PMAS. Tick labels in the PMAS S/N map are in arc-seconds; the scaling is logarithmic from 1 to 103 and only spaxels with S/N> 1 are shown. The third panel shows the LARS Lyα images with a colour bar indicating the flux scale in cgs-units; scaling is the same as in the Hα map. The fourth panel shows resolution-corrected HαvFWHM maps from our PMAS observations and the corresponding HαvLOS maps are shown in the fifth panel. In the first and third panel, we indicate the position and extent of the PMAS field of view with a white box. Cyan contours in the HST Hα image are contours of constant surface brightness, adjusted to highlight the most prominent morphological features. Similarly, magenta contours in the HST Lyα images indicate the Lyα morphology; these contours are also shown in the fourth and fifth panel. To highlight the difference between Lyα and Hα, the Lyα and Hα panels contain as dashed yellow lines the contours from the Hα and Lyα panels, respectively.
Current usage metrics show cumulative count of Article Views (full-text article views including HTML views, PDF and ePub downloads, according to the available data) and Abstracts Views on Vision4Press platform.
Data correspond to usage on the plateform after 2015. The current usage metrics is available 48-96 hours after online publication and is updated daily on week days.
Initial download of the metrics may take a while.