Fig. A.2
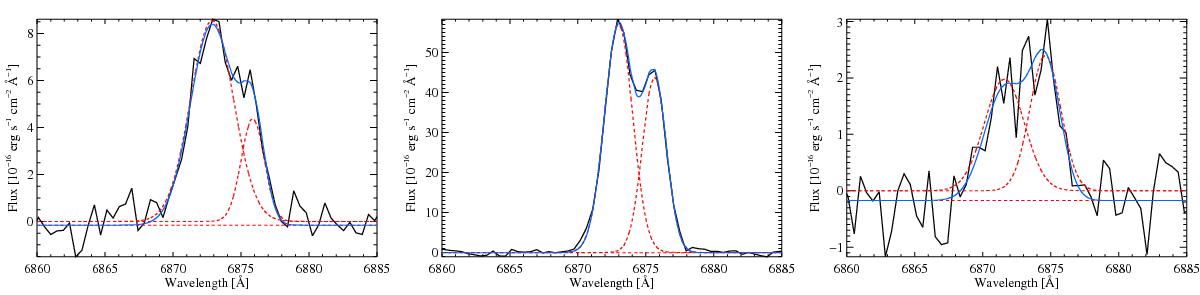
Representative LARS 9 Hα line profiles in red hatched region of Fig. 6, similar to Fig. A.1. The single component fit used to create the map shown in Fig. 6 converged on the stronger blue component in the centre panel, but for the profiles shown in the left and right panels the single component fit is artificially broadened.
Current usage metrics show cumulative count of Article Views (full-text article views including HTML views, PDF and ePub downloads, according to the available data) and Abstracts Views on Vision4Press platform.
Data correspond to usage on the plateform after 2015. The current usage metrics is available 48-96 hours after online publication and is updated daily on week days.
Initial download of the metrics may take a while.