Fig. A.1
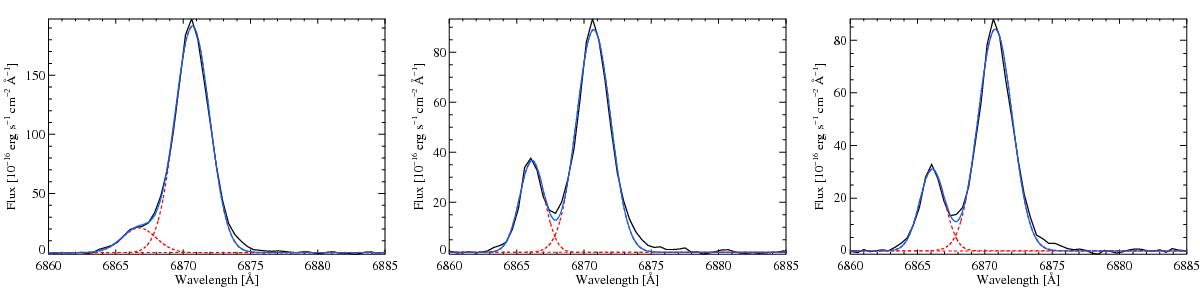
Representative LARS 9 Hα line profiles in blue hatched region of Fig. 6 described by a fit using two Gaussian components. The red dashed lines show the individual components and the blue line shows the sum, while the black line shows the profile as observed. For all profiles shown the single component fit used to create the map shown in Fig. 6 converged on the stronger red component.
Current usage metrics show cumulative count of Article Views (full-text article views including HTML views, PDF and ePub downloads, according to the available data) and Abstracts Views on Vision4Press platform.
Data correspond to usage on the plateform after 2015. The current usage metrics is available 48-96 hours after online publication and is updated daily on week days.
Initial download of the metrics may take a while.