Free Access
Fig. 1
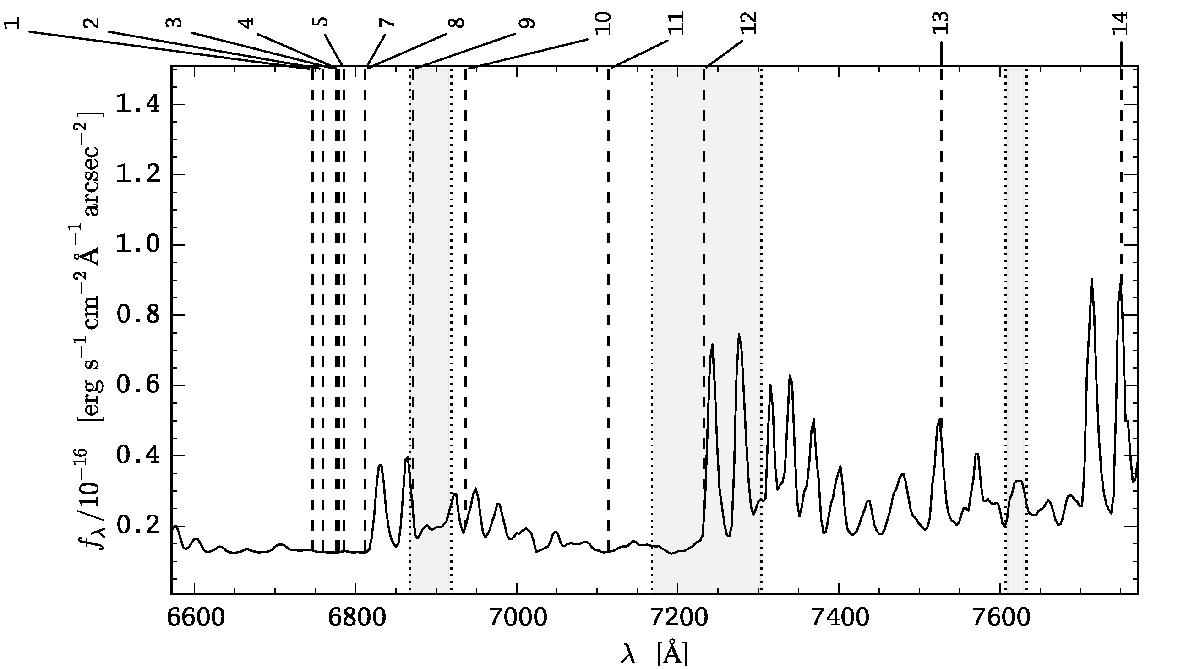
Wavelengths of the redshifted Hα lines of the LARS galaxies (vertical dashed lines) compared to the night sky emission spectrum at Calar Alto (Sánchez et al. 2007a). Grey regions indicate the telluric absorption bands (O2B-Band: 6887 Å−6919 Å, O2A-Band: 7607 Å−7633 Å, and H2O a-Band: 7168 Å−7304 Å, see e.g. Cox 2000).
Current usage metrics show cumulative count of Article Views (full-text article views including HTML views, PDF and ePub downloads, according to the available data) and Abstracts Views on Vision4Press platform.
Data correspond to usage on the plateform after 2015. The current usage metrics is available 48-96 hours after online publication and is updated daily on week days.
Initial download of the metrics may take a while.