Fig. 4
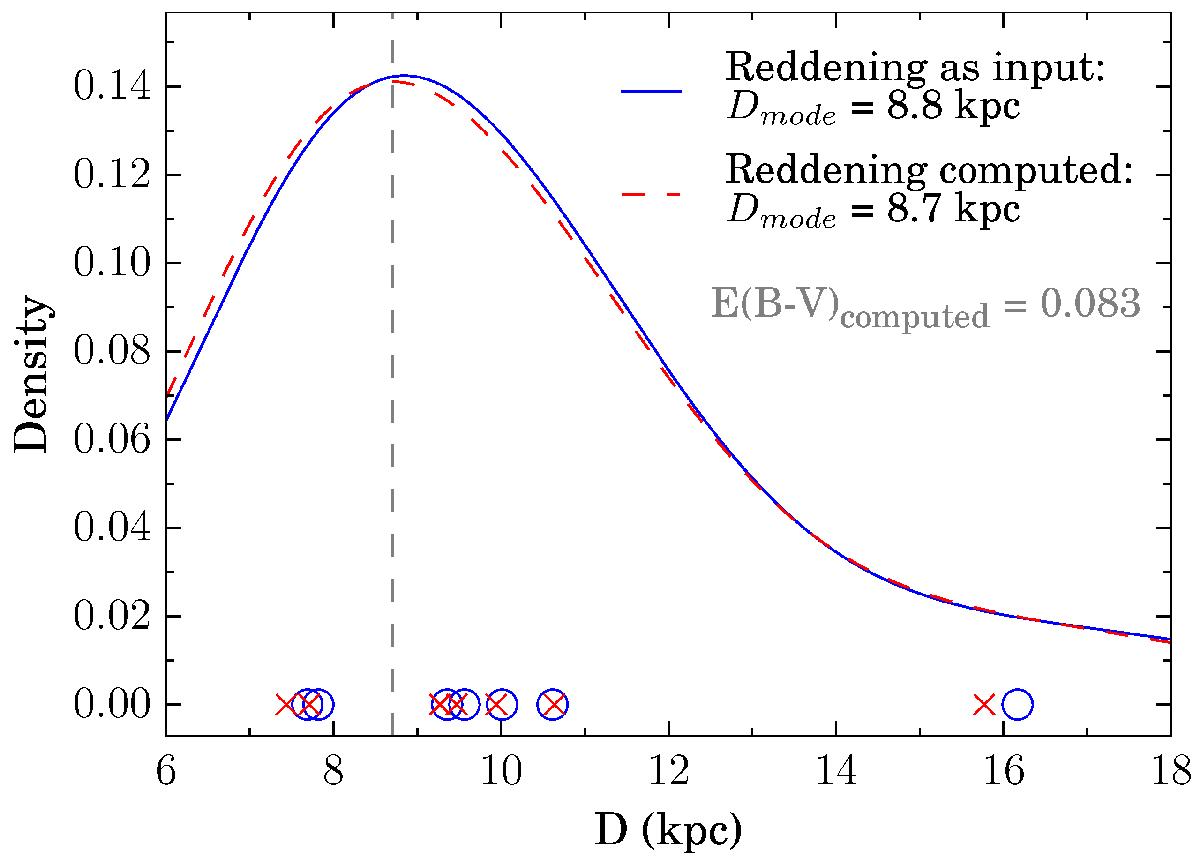
Distance probability function of NGC 6723. Symbols at the bottom stand for the distances determined for individual stars. A blue solid line depicts the global pdf generated from individual distances (depicted as blue circles) determined using reddening values from external measurements. On the other hand, a red dashed line depicts the global pdf generated from individual distances (depicted by the red crosses) determined using reddening values computed simultaneously with the respective distances. In each case, errors on individual distance measurements are considered to compute the global cluster distance pdf, assuming each individual star as a Gaussian random variable around the measured value. The modes of the pdfs are quoted, and provide our best estimates for the distance of NGC 6723. The estimated average reddening toward the cluster is also quoted in the panel. A vertical gray dashed line indicates the distance of NGC 6723 as given in the Harris (1996) compilation.
Current usage metrics show cumulative count of Article Views (full-text article views including HTML views, PDF and ePub downloads, according to the available data) and Abstracts Views on Vision4Press platform.
Data correspond to usage on the plateform after 2015. The current usage metrics is available 48-96 hours after online publication and is updated daily on week days.
Initial download of the metrics may take a while.