Fig. 2
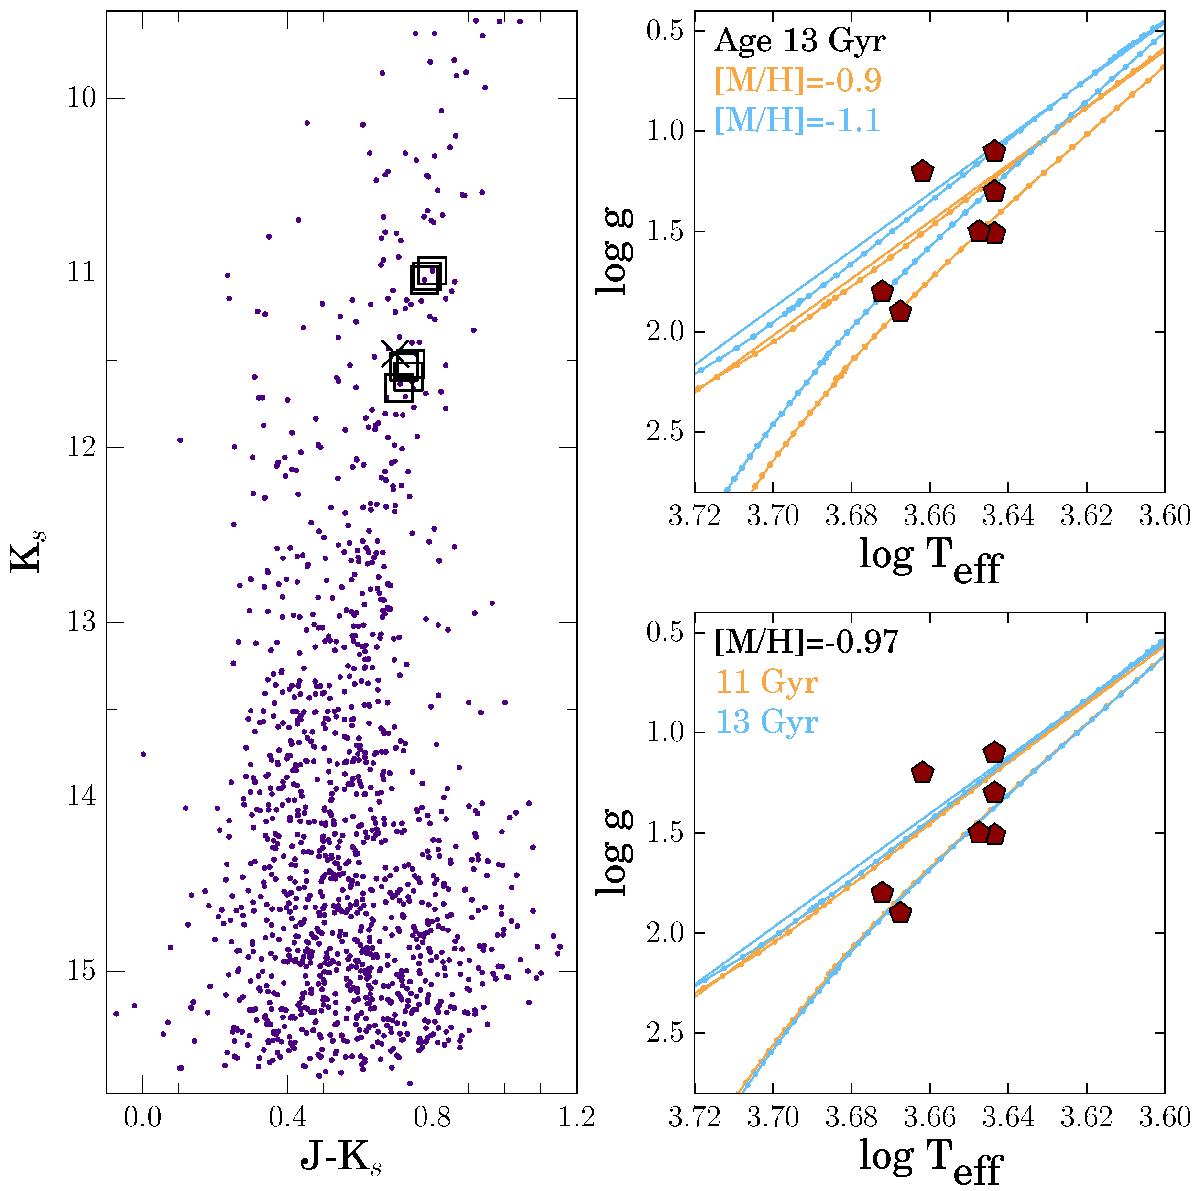
Left panel: Ks vs. J−Ks 2MASS based CMD of the cluster. The spectroscopic targets are marked with black empty squares. The field contaminant star is marked with a cross symbol. Right panels: log (g) vs. Teff diagrams for the spectroscopic sample. PARSEC (Bressan et al. 2012) 13 Gyr isochrones for metallicity [M/H] = −0.9 dex and [M/H] = −1.1 dex are overplotted in the upper panel, while two isochrones of 11 and 13 Gyr with the cluster metallicity in the lower panel.
Current usage metrics show cumulative count of Article Views (full-text article views including HTML views, PDF and ePub downloads, according to the available data) and Abstracts Views on Vision4Press platform.
Data correspond to usage on the plateform after 2015. The current usage metrics is available 48-96 hours after online publication and is updated daily on week days.
Initial download of the metrics may take a while.