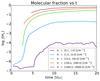
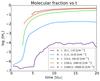
Fig. 11
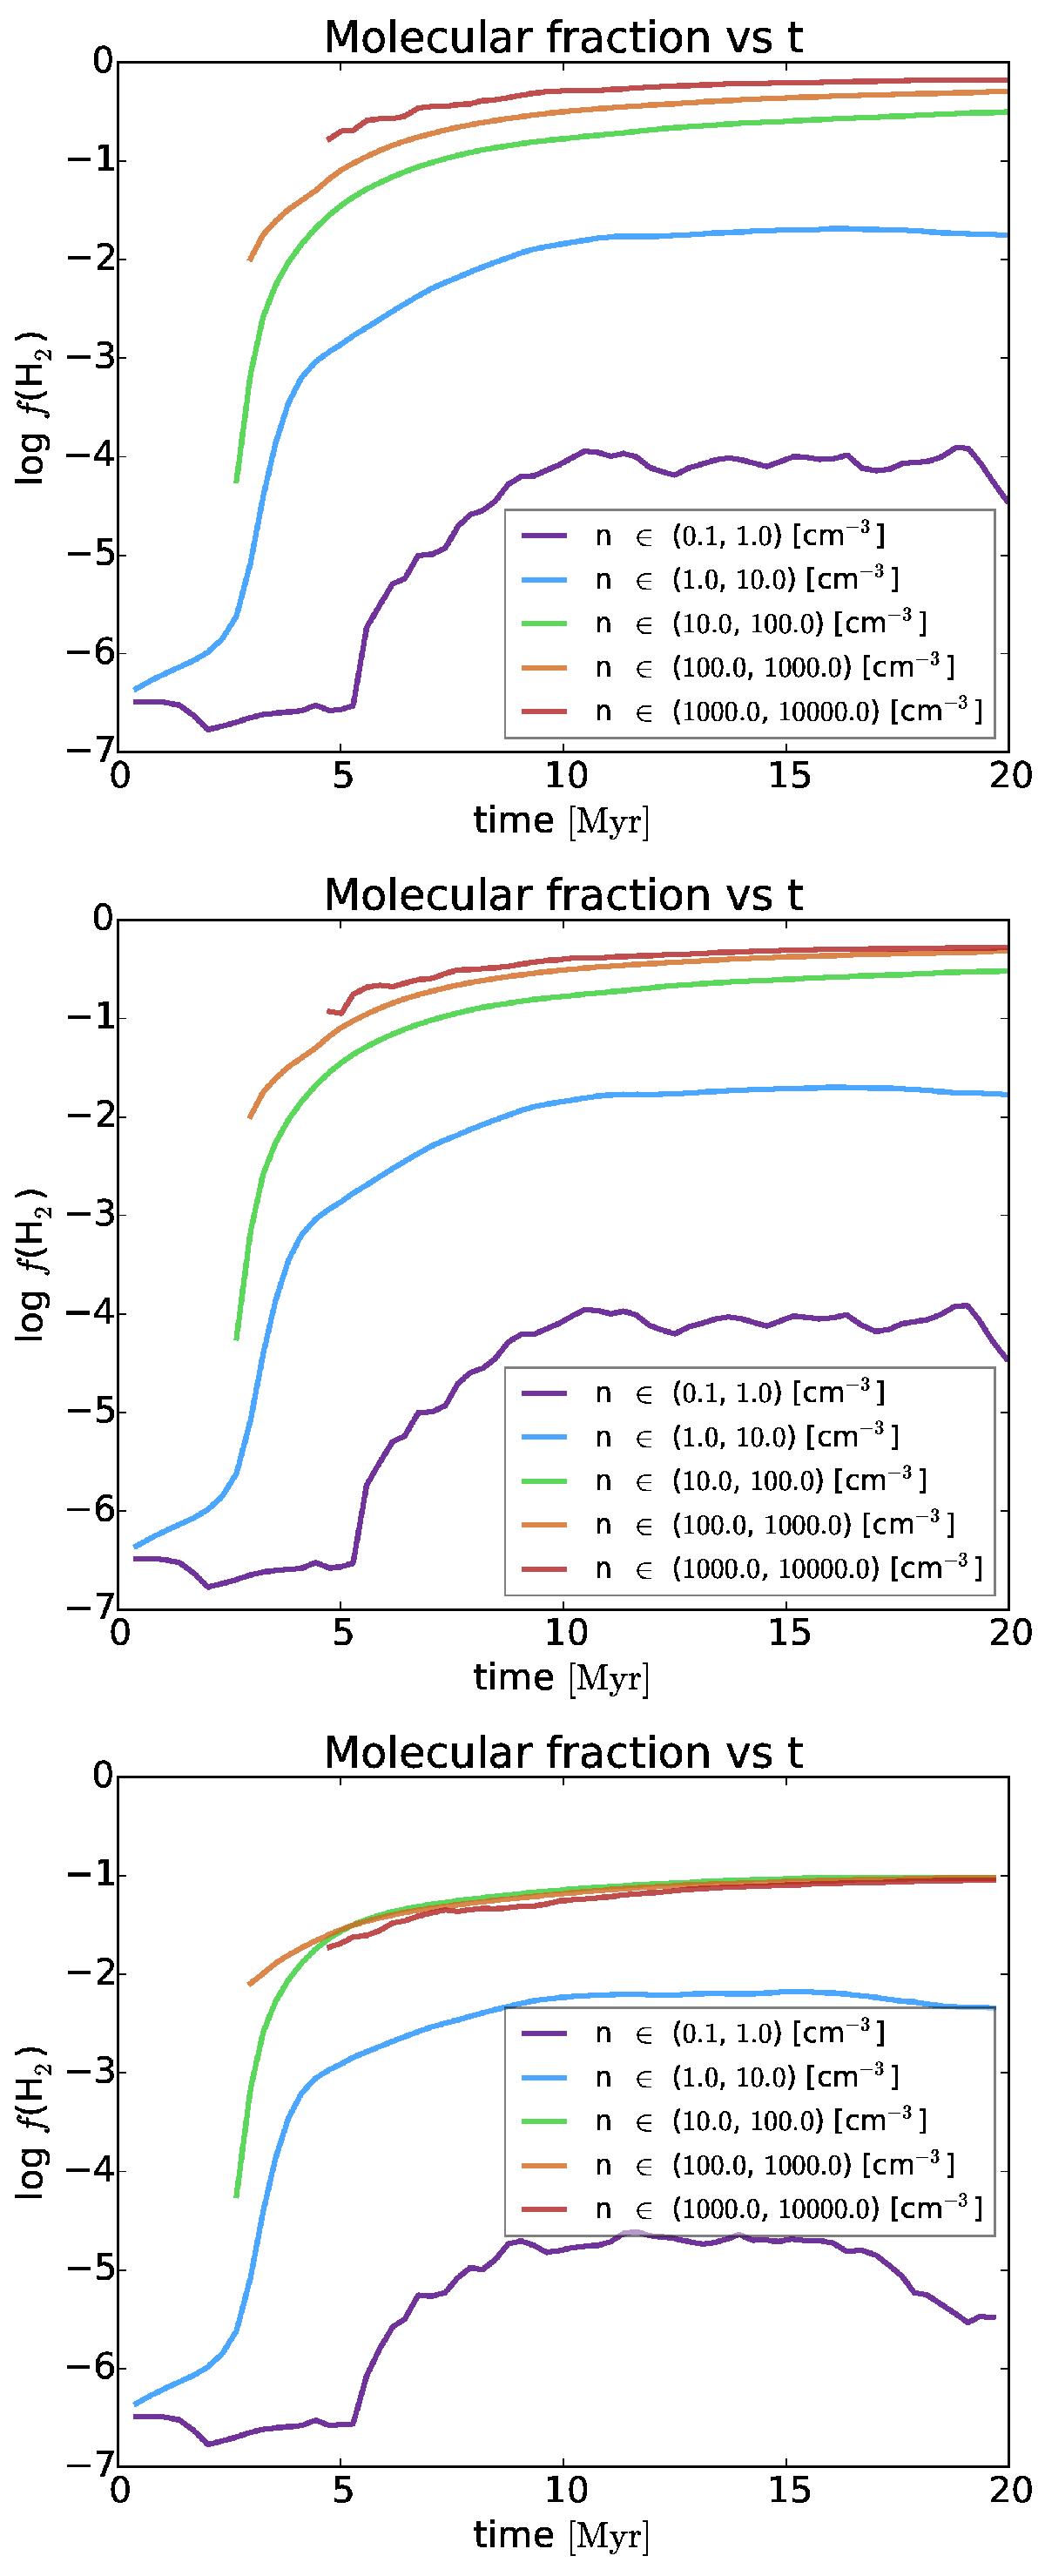
Evolution of the molecular fraction, where the formation of H2 has been suppressed for gas denser than a fixed threshold. The top panel corresponds to the standard case, with no suppression of H2 formation. The middle panel shows the evolution for a density threshold of n = 1000 [ cm-3 ], while the bottom panel corresponds to a density threshold of n = 100 [ cm-3 ]
Current usage metrics show cumulative count of Article Views (full-text article views including HTML views, PDF and ePub downloads, according to the available data) and Abstracts Views on Vision4Press platform.
Data correspond to usage on the plateform after 2015. The current usage metrics is available 48-96 hours after online publication and is updated daily on week days.
Initial download of the metrics may take a while.