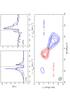
Fig. 7
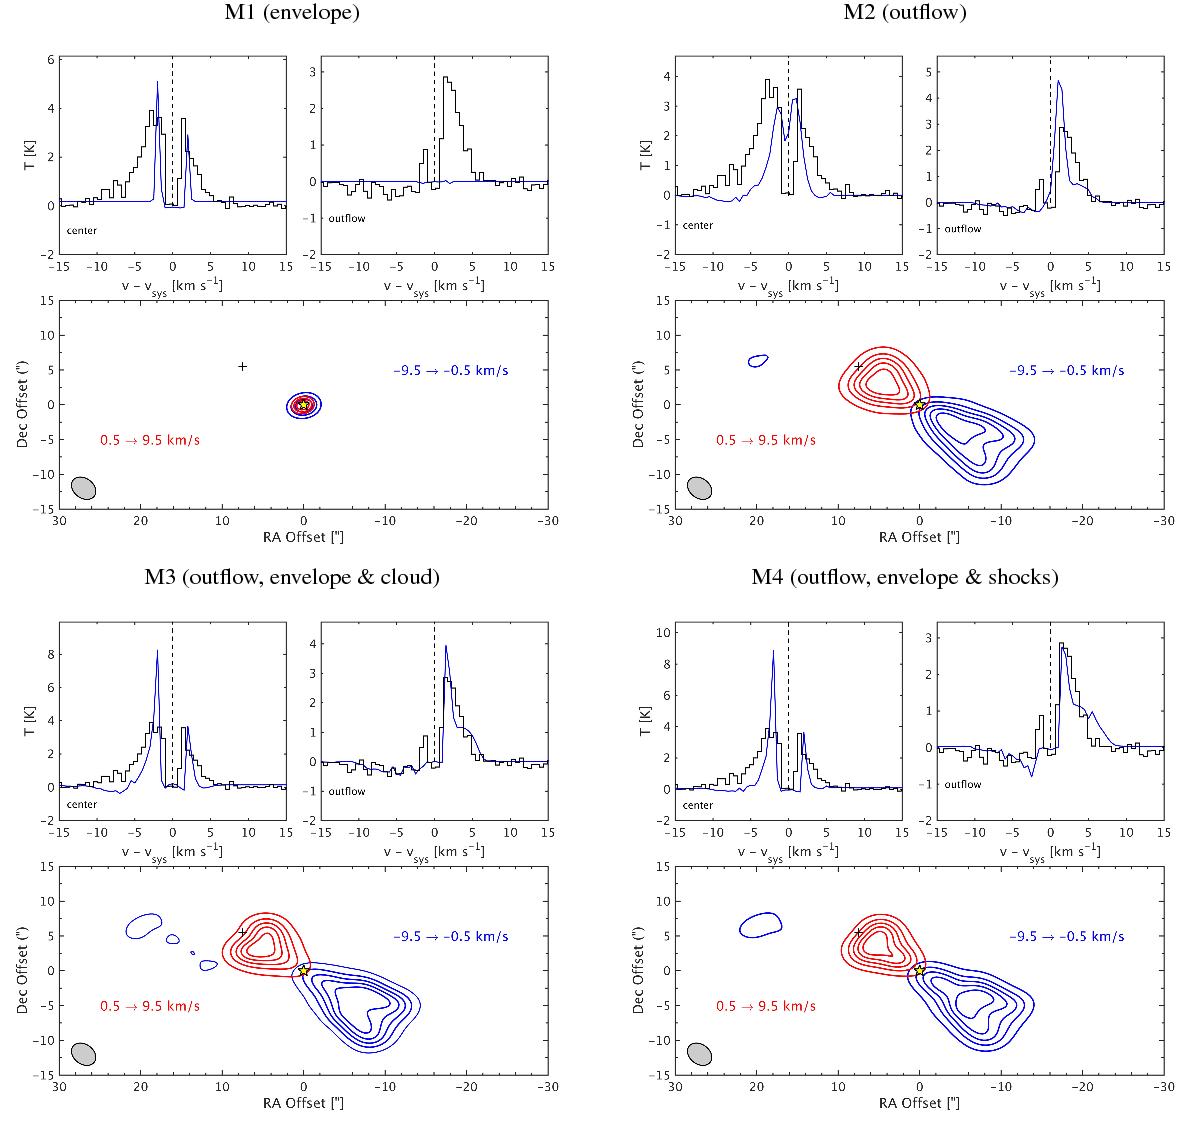
Four different LIME models discussed in the text (M1 in the upper left corner and M4 in the lower right). In each panel, the spectrum towards the central region and one outflow position is presented. The observed spectra are plotted as black histograms while the modelled spectra are plotted with blue continuous lines. A contour plot is also presented for each model, where the integrated intensity has been calculated over the red and blue line wings, respectively. The beam size is indicated with a grey ellipse.
Current usage metrics show cumulative count of Article Views (full-text article views including HTML views, PDF and ePub downloads, according to the available data) and Abstracts Views on Vision4Press platform.
Data correspond to usage on the plateform after 2015. The current usage metrics is available 48-96 hours after online publication and is updated daily on week days.
Initial download of the metrics may take a while.