Fig. 5
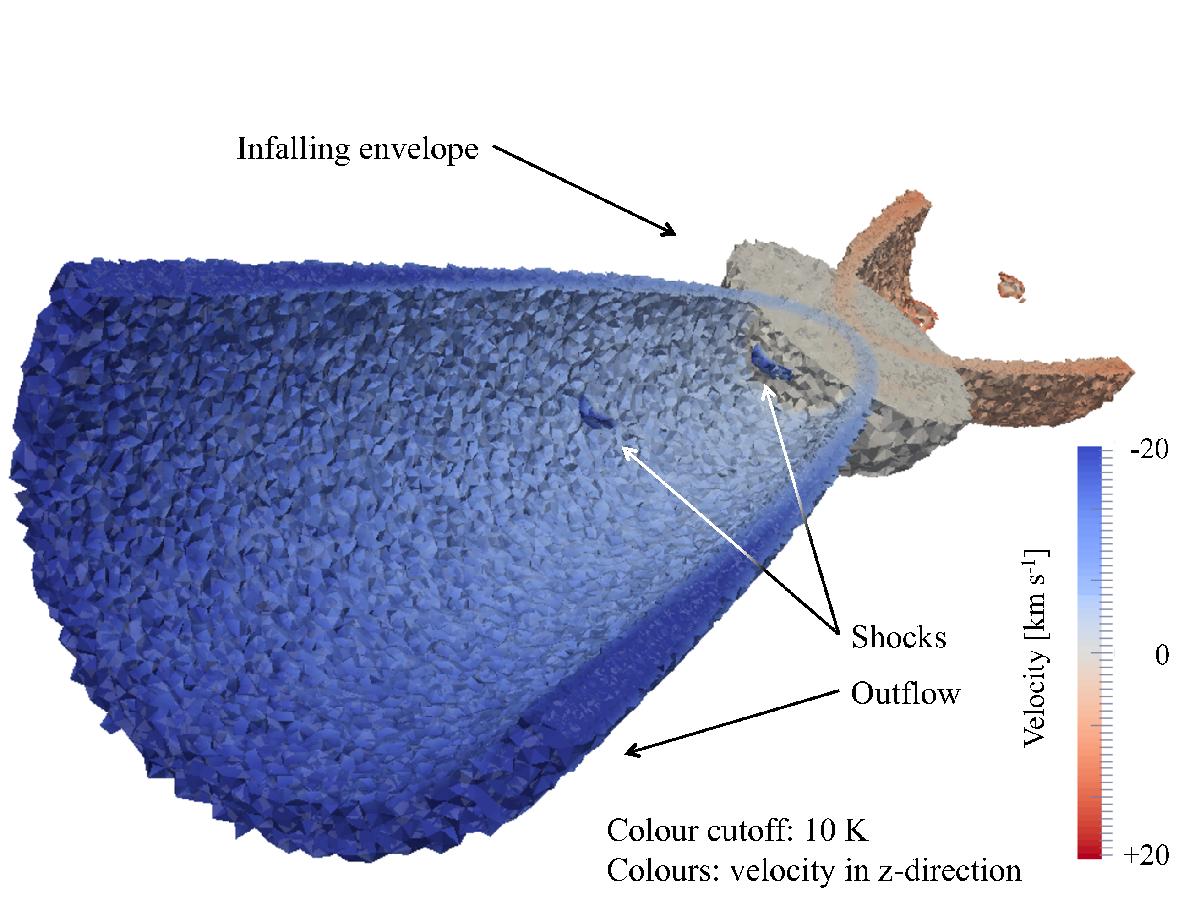
A cut through the radiative transfer model described in the text (partially transparent). The model is viewed from the south-west direction for clarity. Included in the figure, is the molecular outflow, shocked regions along the jet axis and infalling envelope. Colours show the velocity field in the outflow direction in the regions where the temperature is higher than 10 K. The surrounding cloud component, which is also included in the modelling, is not presented in this figure.
Current usage metrics show cumulative count of Article Views (full-text article views including HTML views, PDF and ePub downloads, according to the available data) and Abstracts Views on Vision4Press platform.
Data correspond to usage on the plateform after 2015. The current usage metrics is available 48-96 hours after online publication and is updated daily on week days.
Initial download of the metrics may take a while.