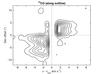
Fig. 4
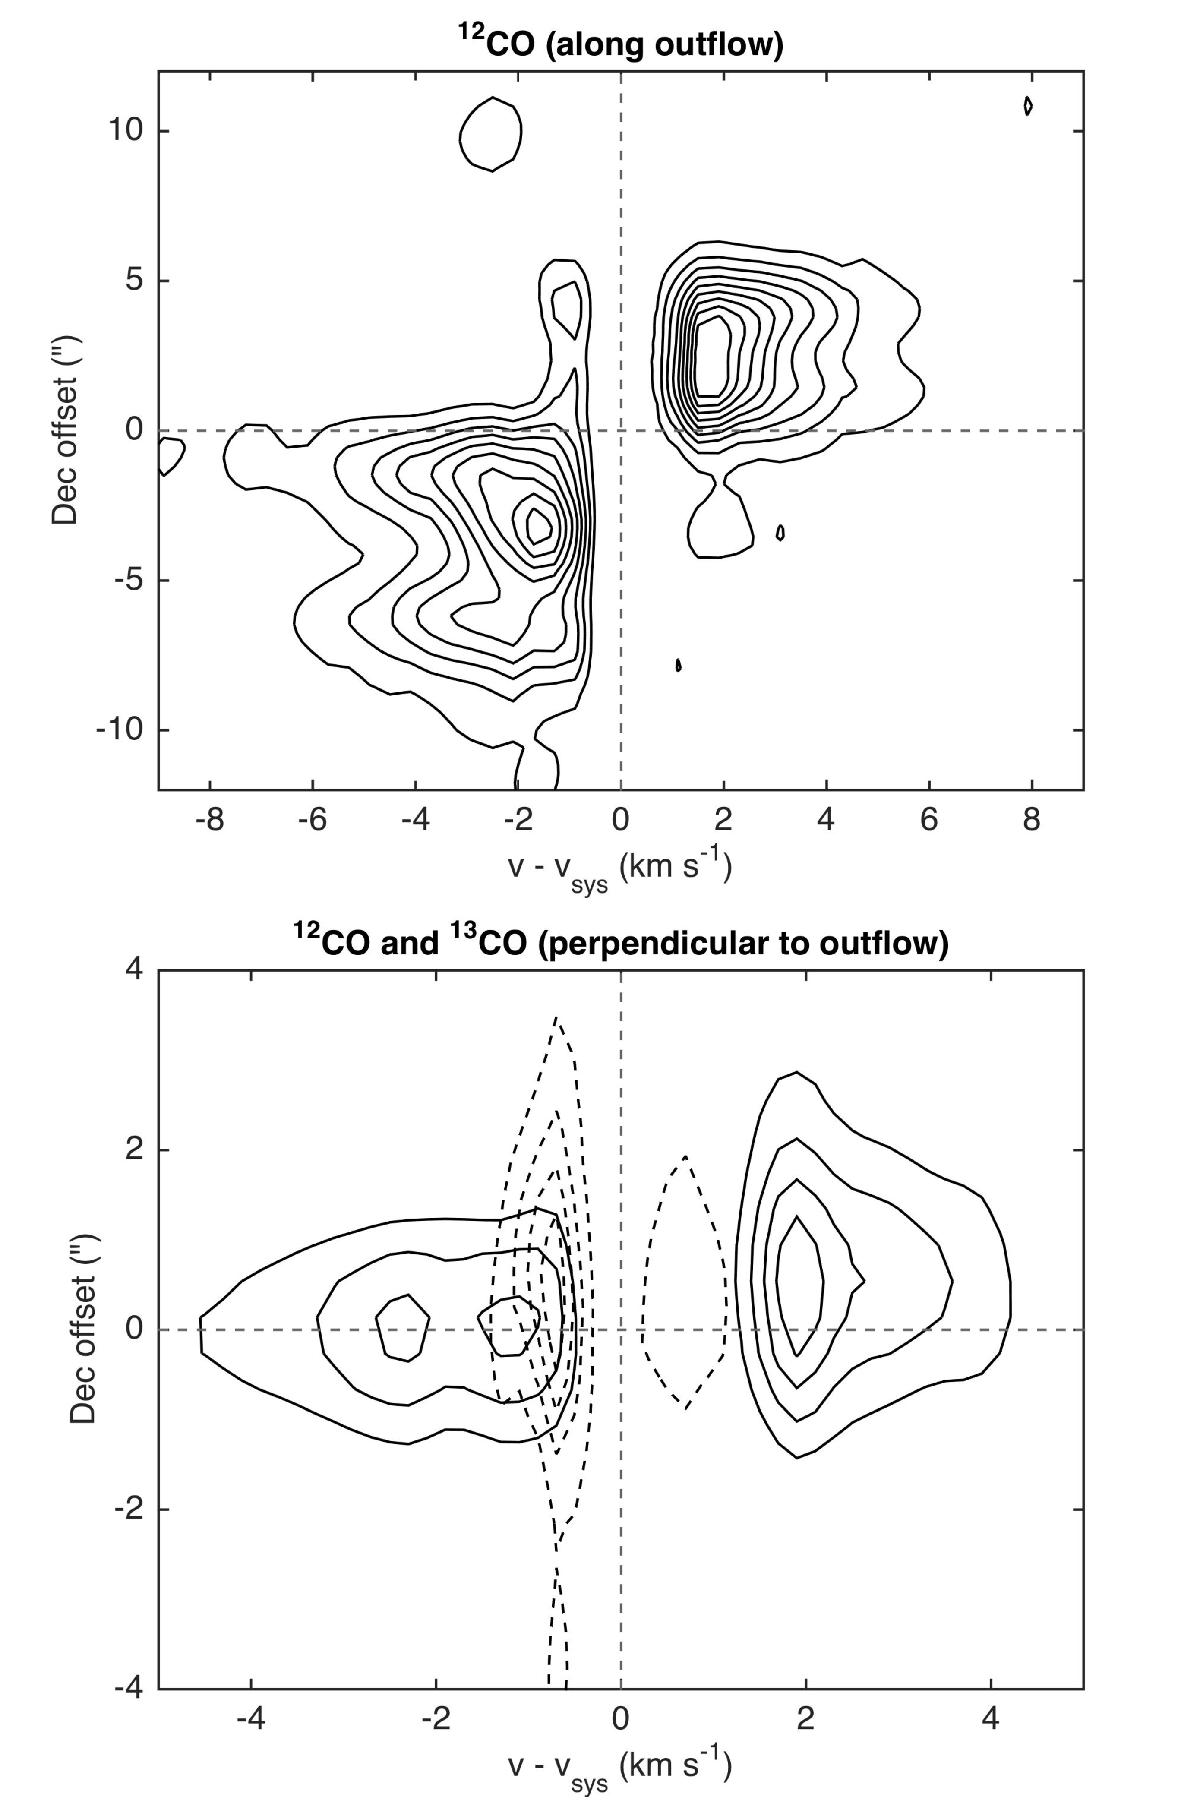
Position velocity diagram along the outflow direction (upper panel) and along the direction of the presumed disk structure (lower panel). Solid contours are for 12CO and dashed contours are for 13CO. The cut along the outflow direction reveals episodic ejection events and weak signs of acceleration along the outflow axis. υ − υsys and the position of the source are indicated with dashed grey lines. Note that the ordinate shows the offset in declination from the central source.
Current usage metrics show cumulative count of Article Views (full-text article views including HTML views, PDF and ePub downloads, according to the available data) and Abstracts Views on Vision4Press platform.
Data correspond to usage on the plateform after 2015. The current usage metrics is available 48-96 hours after online publication and is updated daily on week days.
Initial download of the metrics may take a while.