Fig. 3
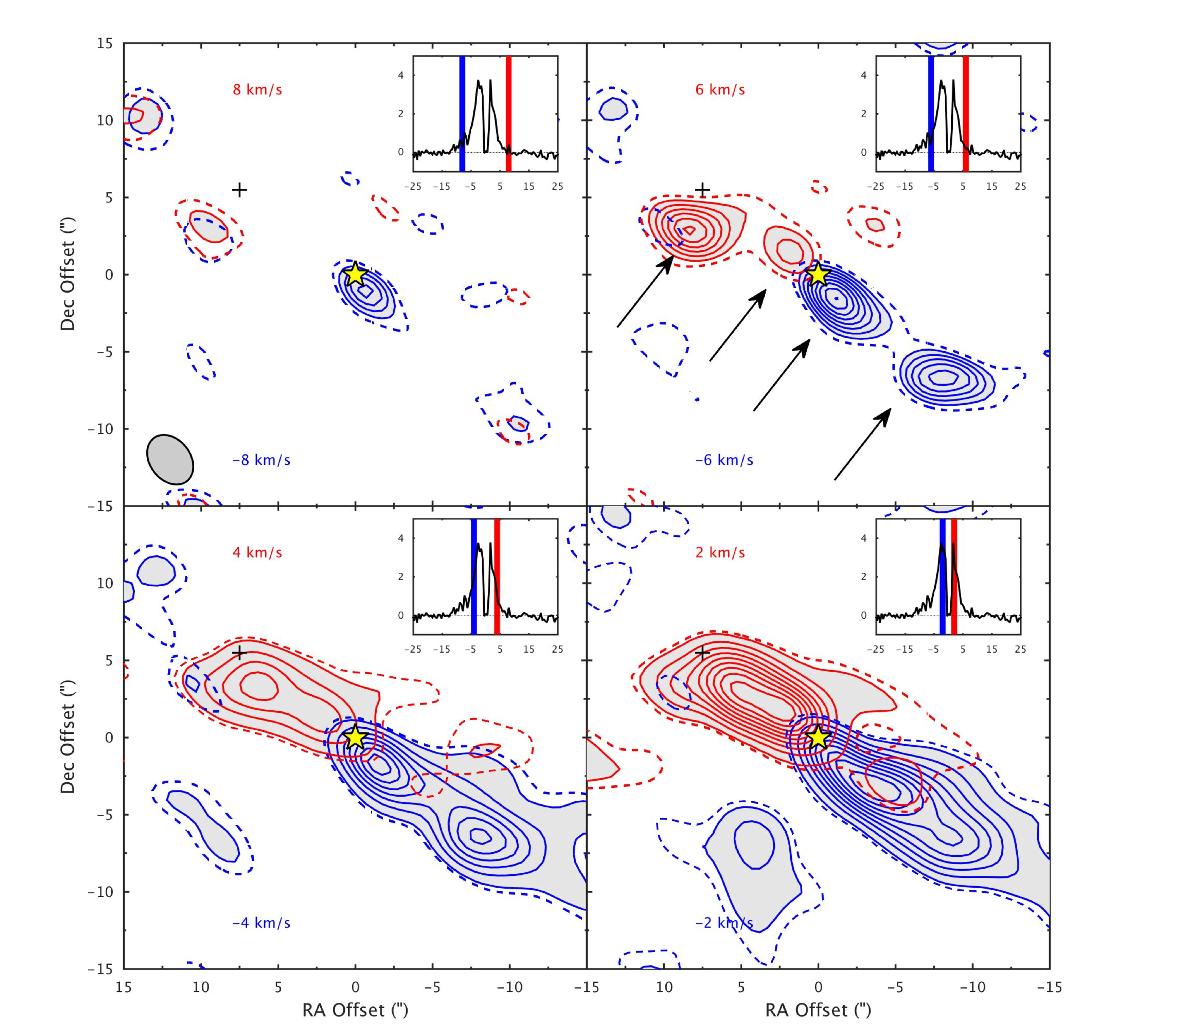
Integrated 12CO emission in different velocity intervals, where Δυ = 2km s-1 (inset in each panel). The centre velocities (υ − υsys) for each bins are indicated in the respective panels. High-velocity gas (Δυ> 5km s-1) is detected in four different spots along the outflow axis (indicated with black arrows in the upper right panel). First solid thick contour is at 3σ and the 2σ level is indicated with a dashed line.
Current usage metrics show cumulative count of Article Views (full-text article views including HTML views, PDF and ePub downloads, according to the available data) and Abstracts Views on Vision4Press platform.
Data correspond to usage on the plateform after 2015. The current usage metrics is available 48-96 hours after online publication and is updated daily on week days.
Initial download of the metrics may take a while.