Fig. 2
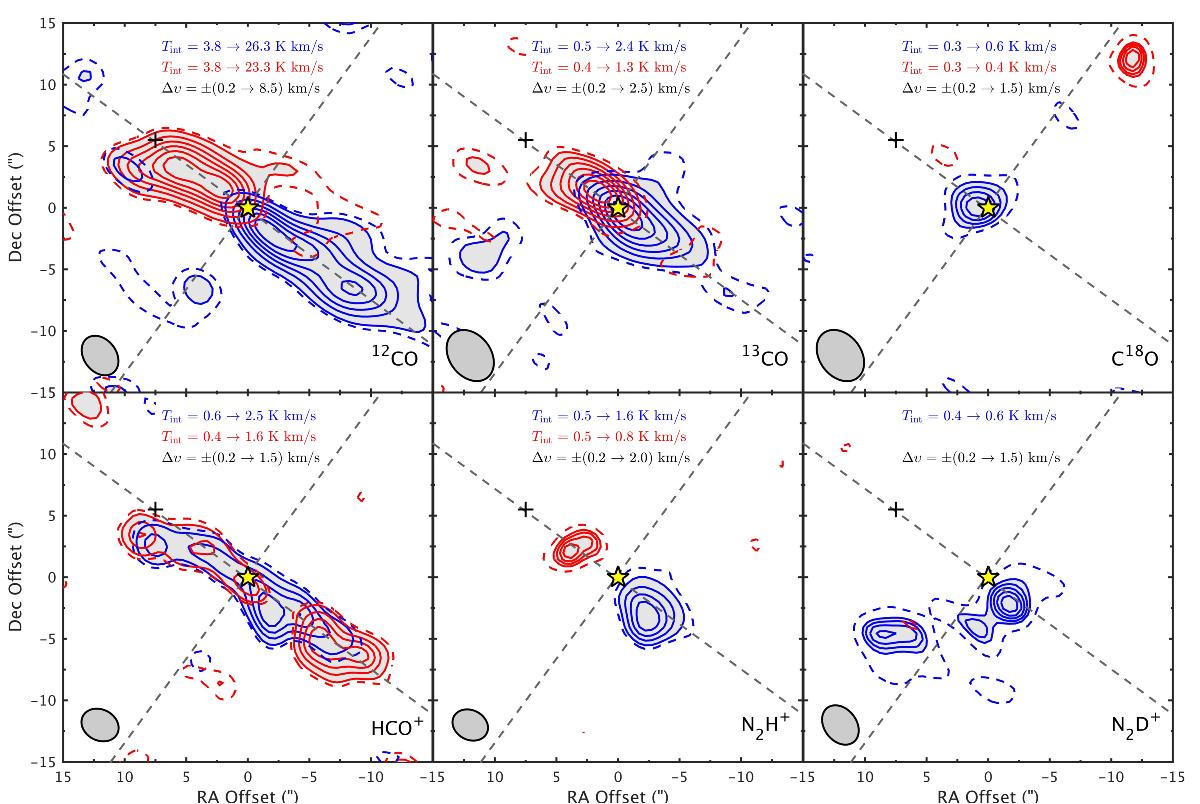
Integrated emission in the red and blue outflow lobes. The dashed lines indicate the 2σ levels and the first thick line indicates the 3σ levels. In each panel, the value for the first and last contour in the shaded region are given, together with the velocity intervals over which the emission has been integrated. The beam size and molecules are shown in the lower corners of each panel. Dashed grey lines indicate the cut for the position-velocity diagram presented in Fig. 4. The location of the central source is indicated with a yellow star and the location of the outflow position discussed in Sect. 4.2.2 is indicated with a plus sign. The maps are centred at α2000 = +15h43m02![]() 2; δ2000 = –34°09′06.7′′.
2; δ2000 = –34°09′06.7′′.
Current usage metrics show cumulative count of Article Views (full-text article views including HTML views, PDF and ePub downloads, according to the available data) and Abstracts Views on Vision4Press platform.
Data correspond to usage on the plateform after 2015. The current usage metrics is available 48-96 hours after online publication and is updated daily on week days.
Initial download of the metrics may take a while.