Fig. A.1
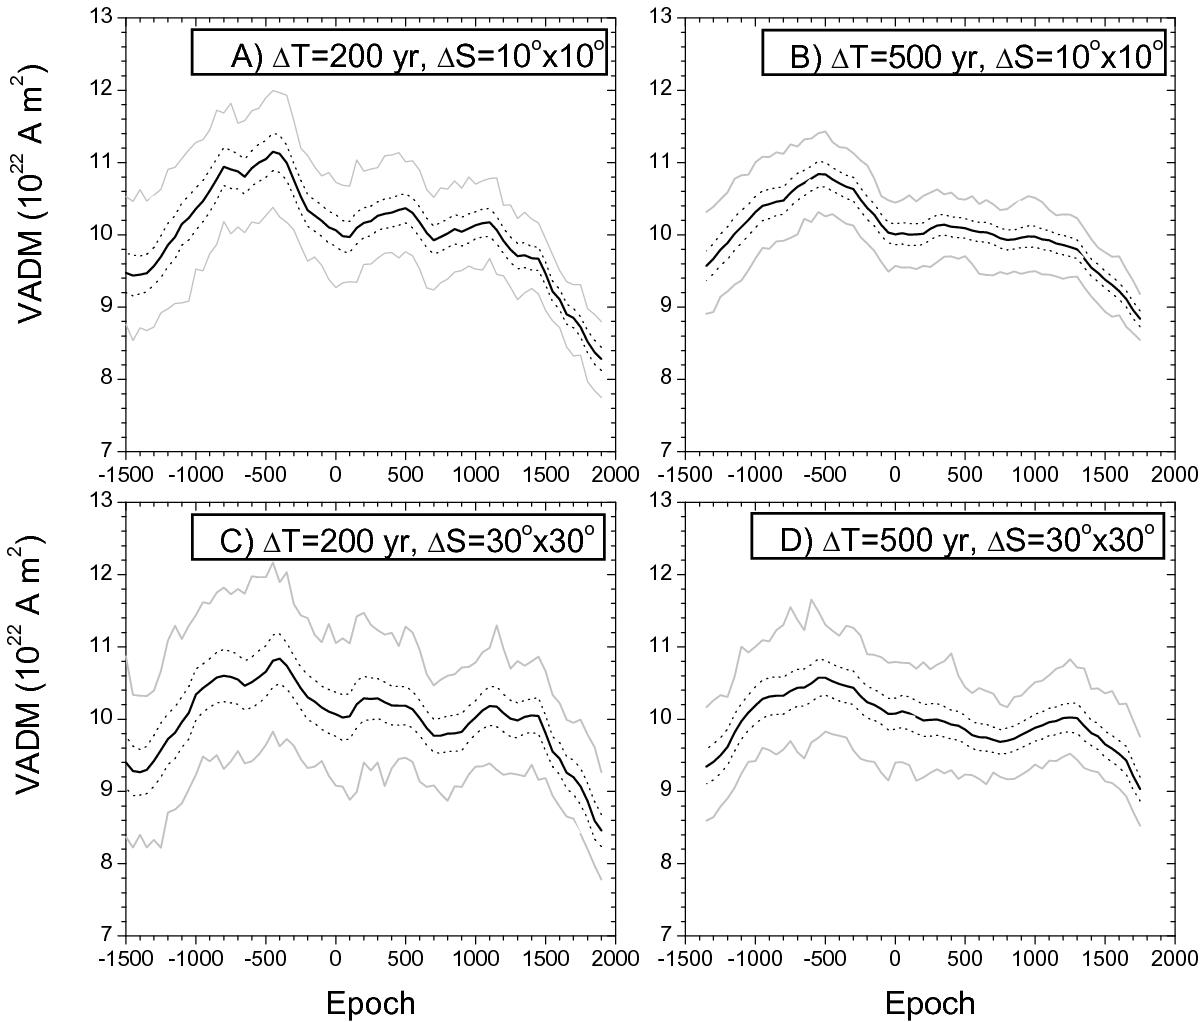
Comparison between VADM curves computed between 1500 BC and 2000 AD using sliding windows of ΔT = 200 years (panels A), C)) and 500 years (B), D)) shifted by 50 years, and using a weighting over regions of ΔS = 10° × 10° (A), B)) and ΔS = 30° × 30° (C), D) width. The thick black line exhibits the averaged VADM computed using a bootstrap scheme (see main text and legend of Tables C.1 and C.2 available at CDS), with its 1σ uncertainties (dotted lines) and the envelope of possible VADM values (gray lines).
Current usage metrics show cumulative count of Article Views (full-text article views including HTML views, PDF and ePub downloads, according to the available data) and Abstracts Views on Vision4Press platform.
Data correspond to usage on the plateform after 2015. The current usage metrics is available 48-96 hours after online publication and is updated daily on week days.
Initial download of the metrics may take a while.