Fig. 7
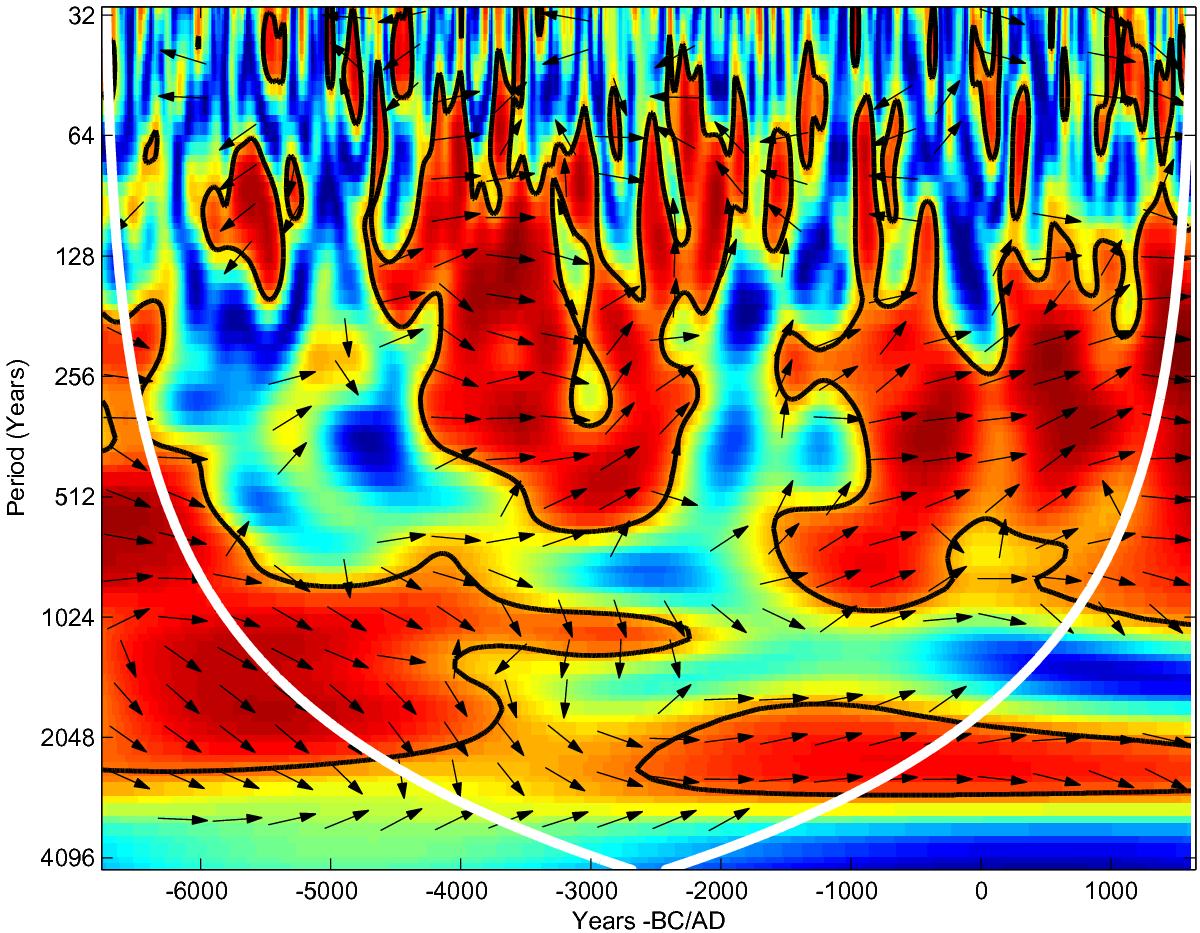
Wavelet coherence between the SN-14C and SN-10Be series. The color code gives the value of the coherence from 0 (blue) to 1 (red). The arrows denote the relative phase between the series so that the right-pointing arrows correspond to an exact in-phase and the left-pointing arrows to an exact anti-phase relation. Black contours delimit the areas of high coherence (95% confidence level). White curves delimit the cone of influence where results can be influenced by the edges of the time series (beyond which the analysis is possibly biased).
Current usage metrics show cumulative count of Article Views (full-text article views including HTML views, PDF and ePub downloads, according to the available data) and Abstracts Views on Vision4Press platform.
Data correspond to usage on the plateform after 2015. The current usage metrics is available 48-96 hours after online publication and is updated daily on week days.
Initial download of the metrics may take a while.