Fig. 6
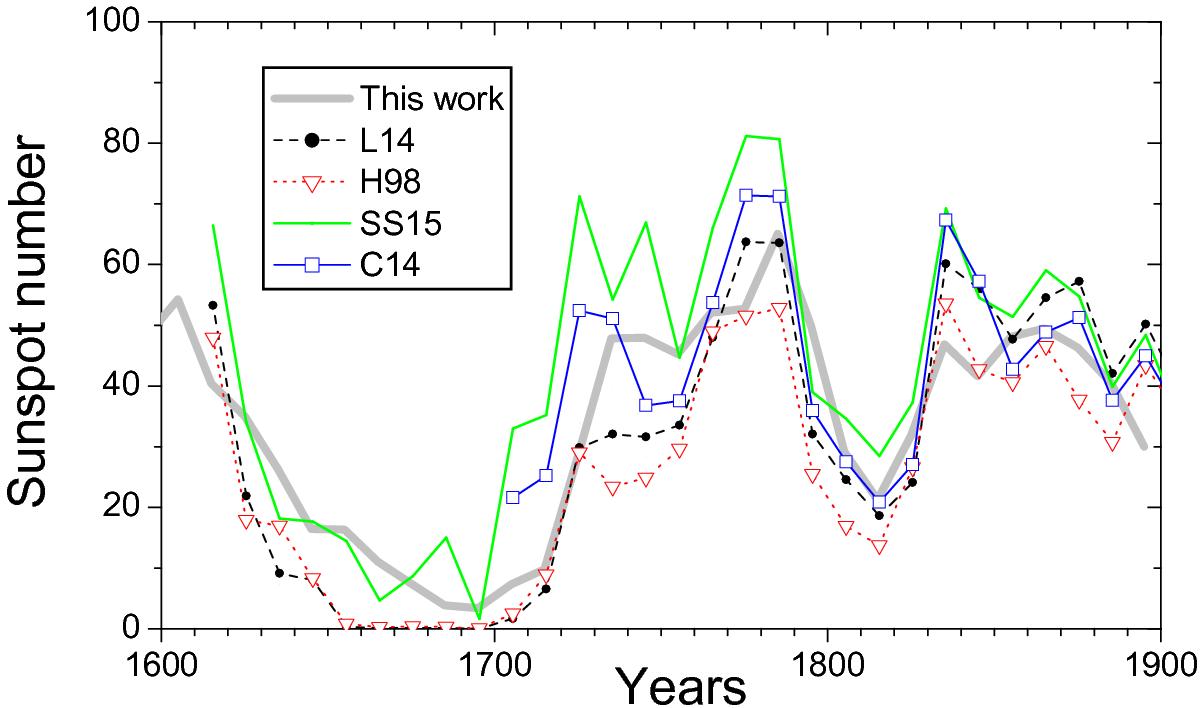
Decadally averaged sunspot numbers for the period 1600–1900 AD. The thick gray curve represents this work (uncertainties are not shown). Other curves correspond to sunspot number series: L14 (Lockwood et al. 2014), H98 (Hoyt & Schatten 1998), SS15 (Svalgaard & Schatten 2015), and the C14 international sunspot number (v.2) scaled with a factor 0.6 (Clette et al. 2014).
Current usage metrics show cumulative count of Article Views (full-text article views including HTML views, PDF and ePub downloads, according to the available data) and Abstracts Views on Vision4Press platform.
Data correspond to usage on the plateform after 2015. The current usage metrics is available 48-96 hours after online publication and is updated daily on week days.
Initial download of the metrics may take a while.