Fig. 5
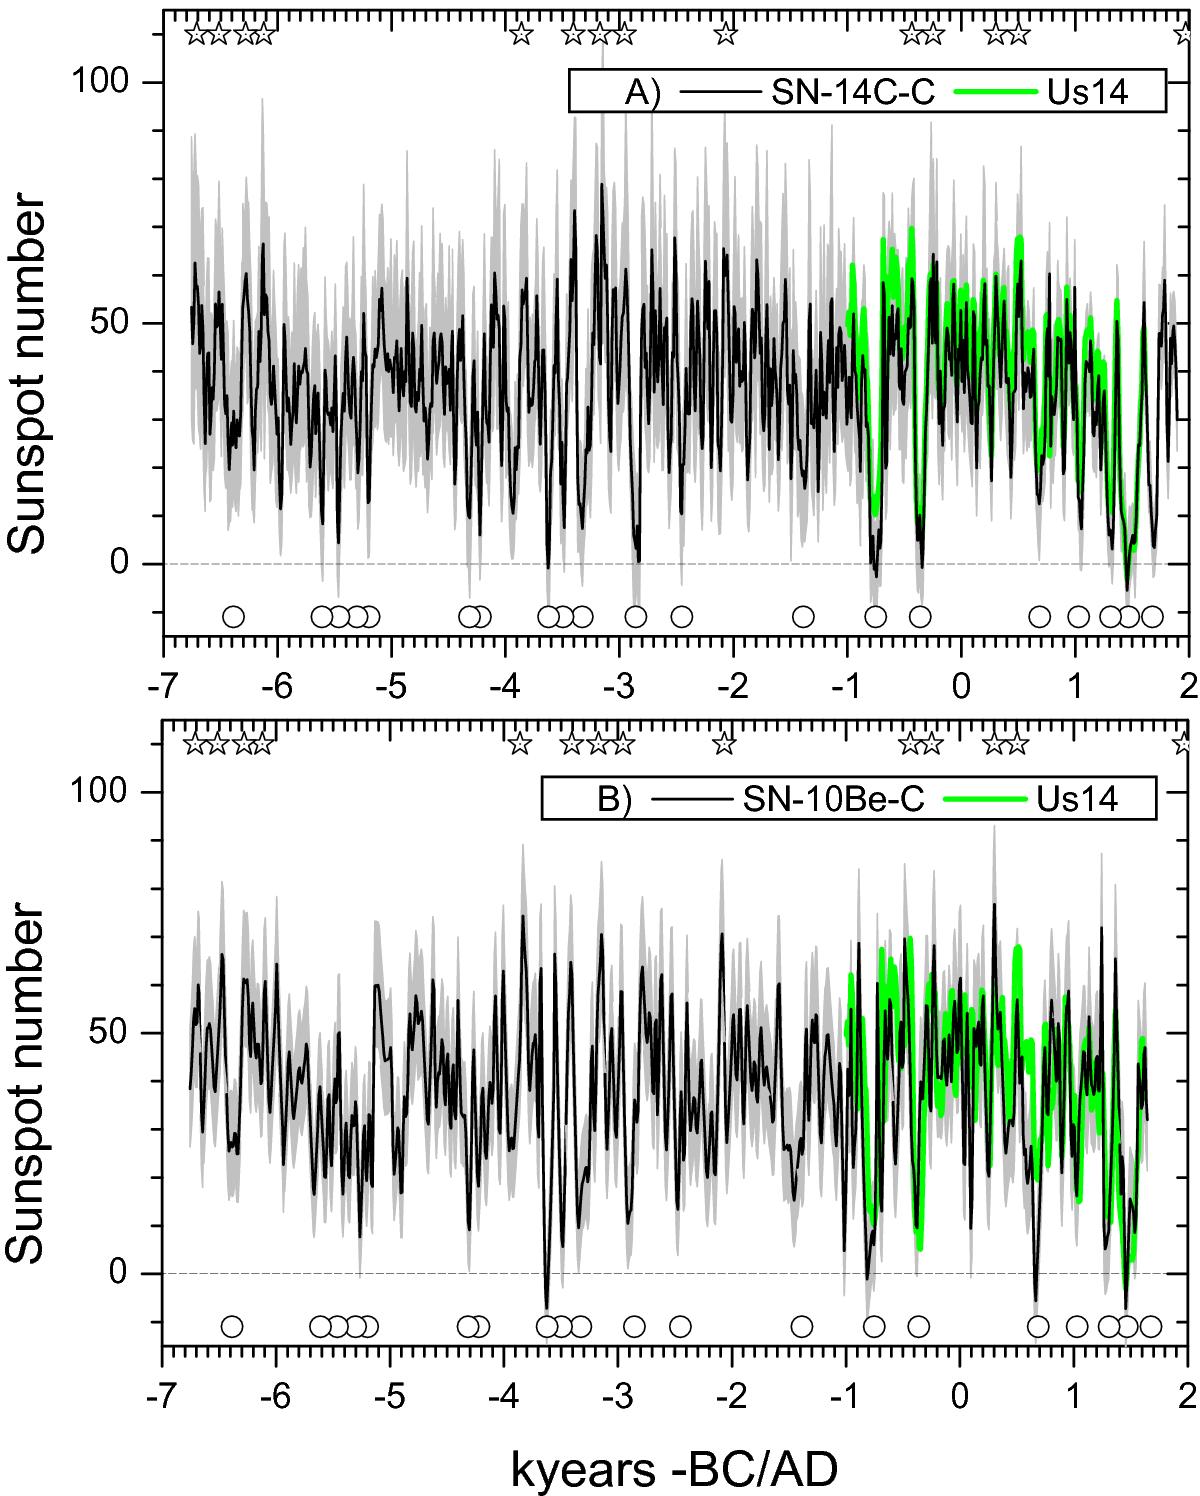
Corrected sunspot number reconstructions SN-14C-C (panel A)) and SN-10Be-C (panel B)), after removing long-term trends (see Sect. 4.1). The black curves and the gray shading depict the mean and the 95% range (over 106 ensemble members) of the reconstructions, respectively, and the green curve represents the 3 kyr reconstruction by Usoskin et al. (2014). Stars and circles denote grand maxima and minima, respectively, as in Fig. 3. Tables for this plot are available at the CDS, including the mean values and the uncertainties of the sunspot numbers reconstructed here as shown in Fig. 5.
Current usage metrics show cumulative count of Article Views (full-text article views including HTML views, PDF and ePub downloads, according to the available data) and Abstracts Views on Vision4Press platform.
Data correspond to usage on the plateform after 2015. The current usage metrics is available 48-96 hours after online publication and is updated daily on week days.
Initial download of the metrics may take a while.