Fig. 3
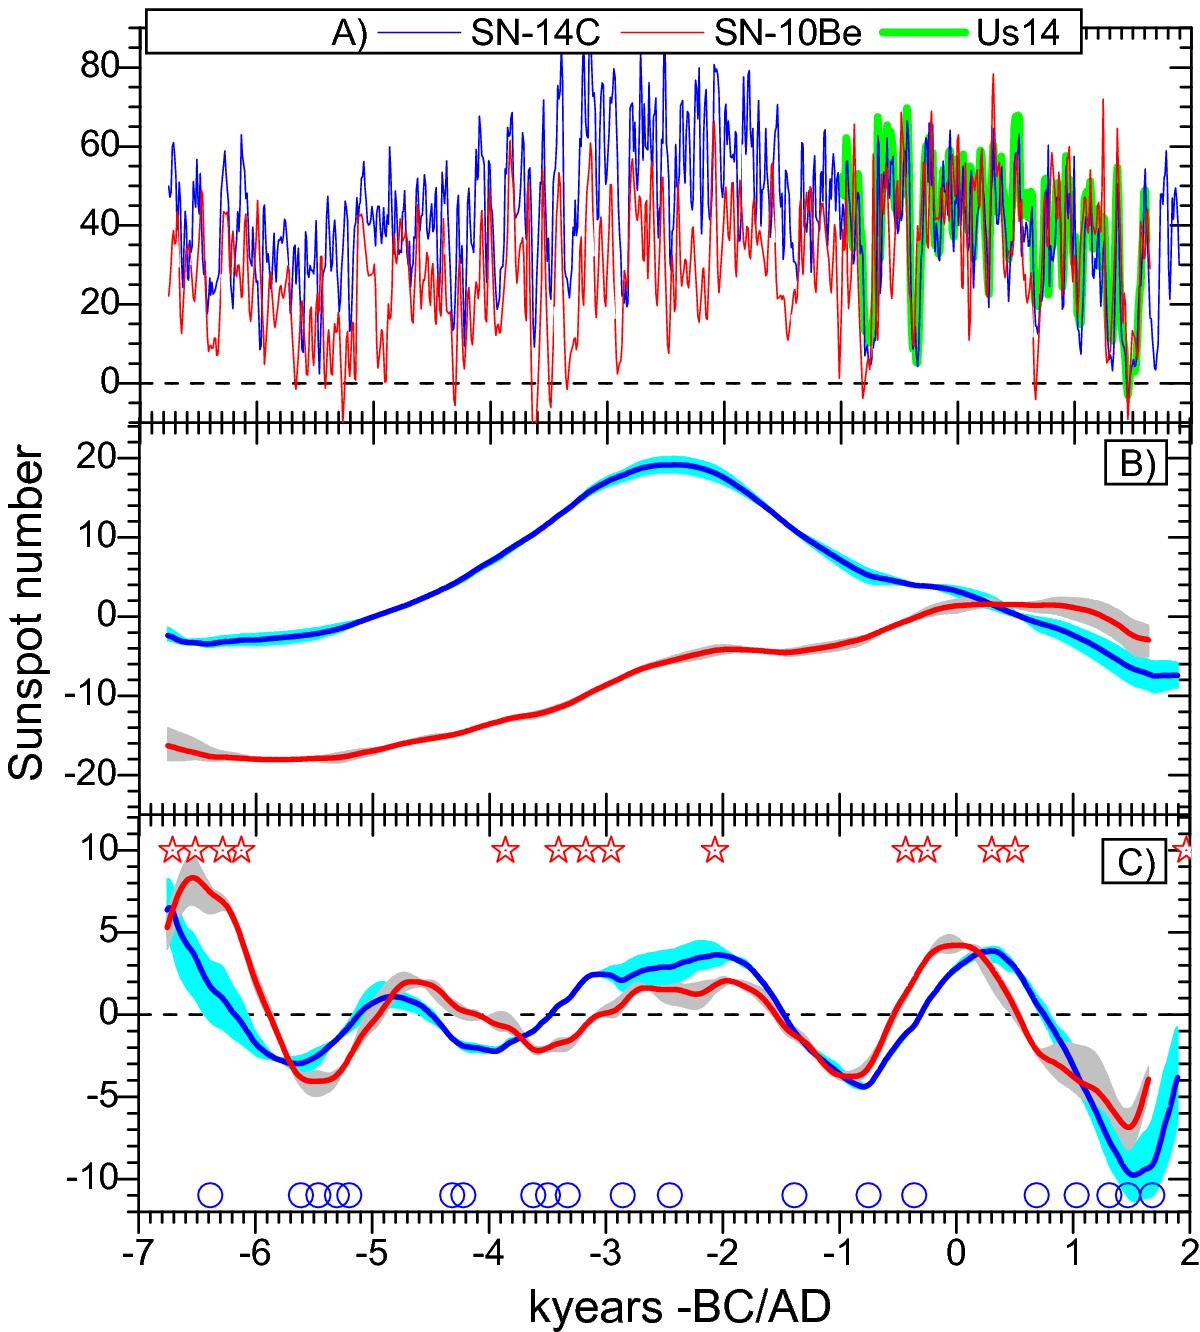
Panel A): raw reconstructions of the sunspot numbers (mean curves) SN-14C (blue) and SN-10Be (red), compared to the recent 3 kyr reconstruction (Usoskin et al. 2014,– green curve). Panel B): first component of the singular spectrum analysis (SSA – see Appendix B) for the SN-14C (blue) and SN-10Be (red) series. The shaded areas depict the uncertainties related to the parameter L of the SSA. Panel C): same as in panel B), but for the second SSA components of the SN-14C (blue) and SN-10Be (red) series. The large dots and red stars denote times of the grand minima (see Table 1) and grand maxima (Table 2), respectively.
Current usage metrics show cumulative count of Article Views (full-text article views including HTML views, PDF and ePub downloads, according to the available data) and Abstracts Views on Vision4Press platform.
Data correspond to usage on the plateform after 2015. The current usage metrics is available 48-96 hours after online publication and is updated daily on week days.
Initial download of the metrics may take a while.