Fig. 2
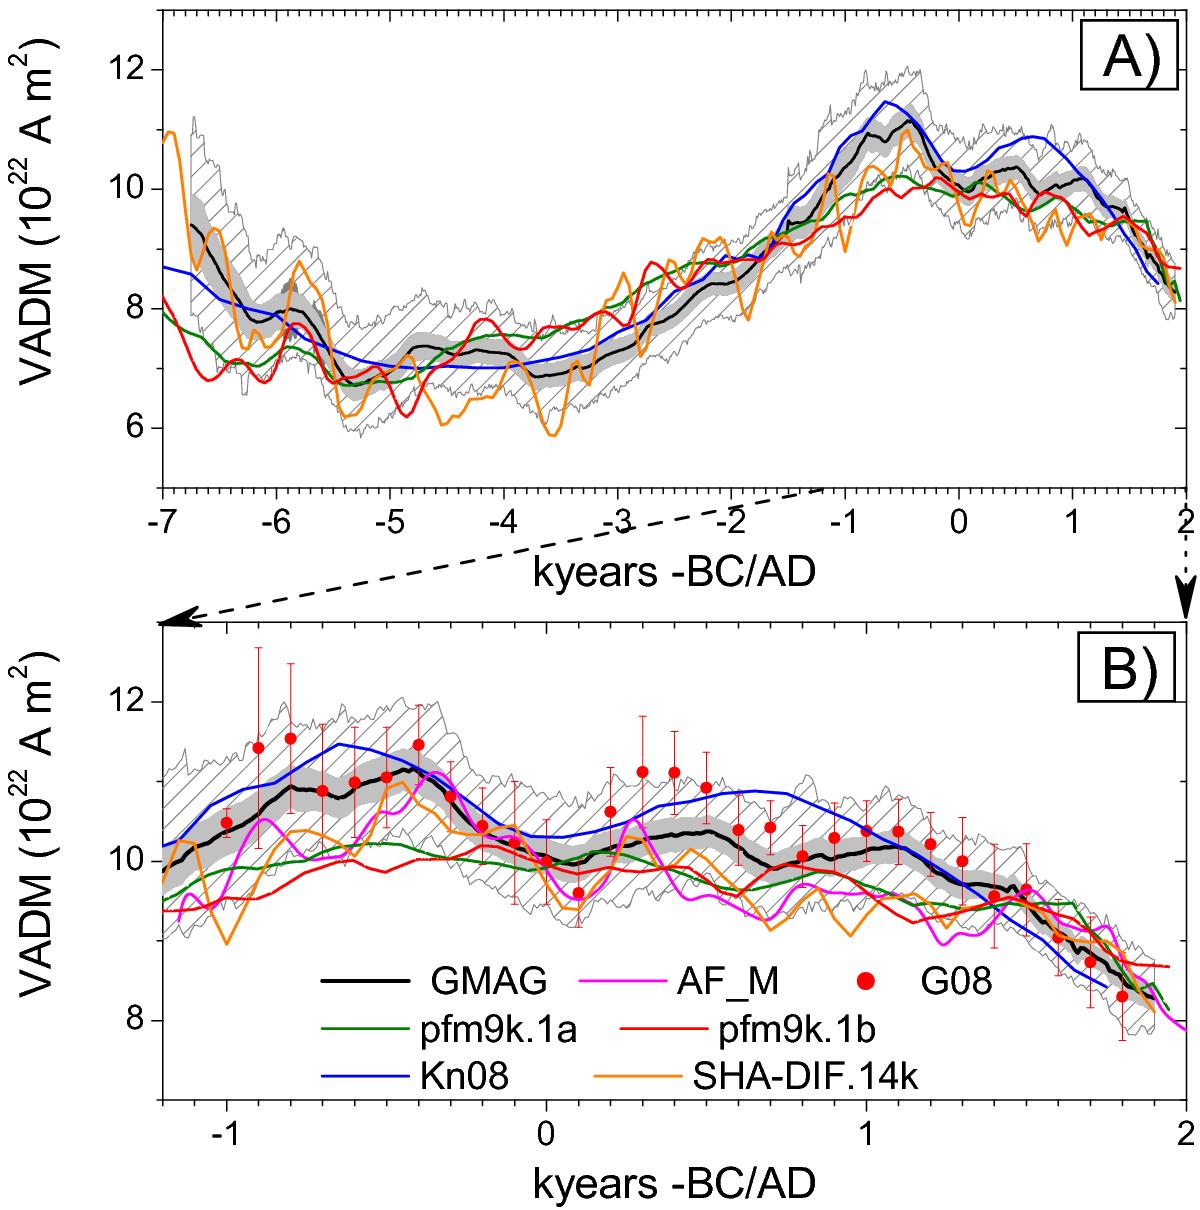
Time series of the axial dipole moment reconstructions spanning the past 9000 years (panel A)), with a zoom for the last 3200 years (panel B)). The black solid line depicts GMAG.9k (the reconstruction presented and used in this work) with ± 1σ and the full range variability presented by the gray shading and the hatching, respectively. Other reconstructions shown are (Licht et al. 2013) denoted as AF_M, (Genevey et al. 2008) denoted as G08, (Nilsson et al. 2014) denoted as pfm9k.1b and pfm9k.1a, (Knudsen et al. 2008) denoted as Kn08, and (Pavón-Carrasco et al. 2014) denoted as SHA-DIF.14k. For better readability, error bars were omitted for these curves, but this does not affect the discussion of the results (see text).
Current usage metrics show cumulative count of Article Views (full-text article views including HTML views, PDF and ePub downloads, according to the available data) and Abstracts Views on Vision4Press platform.
Data correspond to usage on the plateform after 2015. The current usage metrics is available 48-96 hours after online publication and is updated daily on week days.
Initial download of the metrics may take a while.