Free Access
Fig. 6
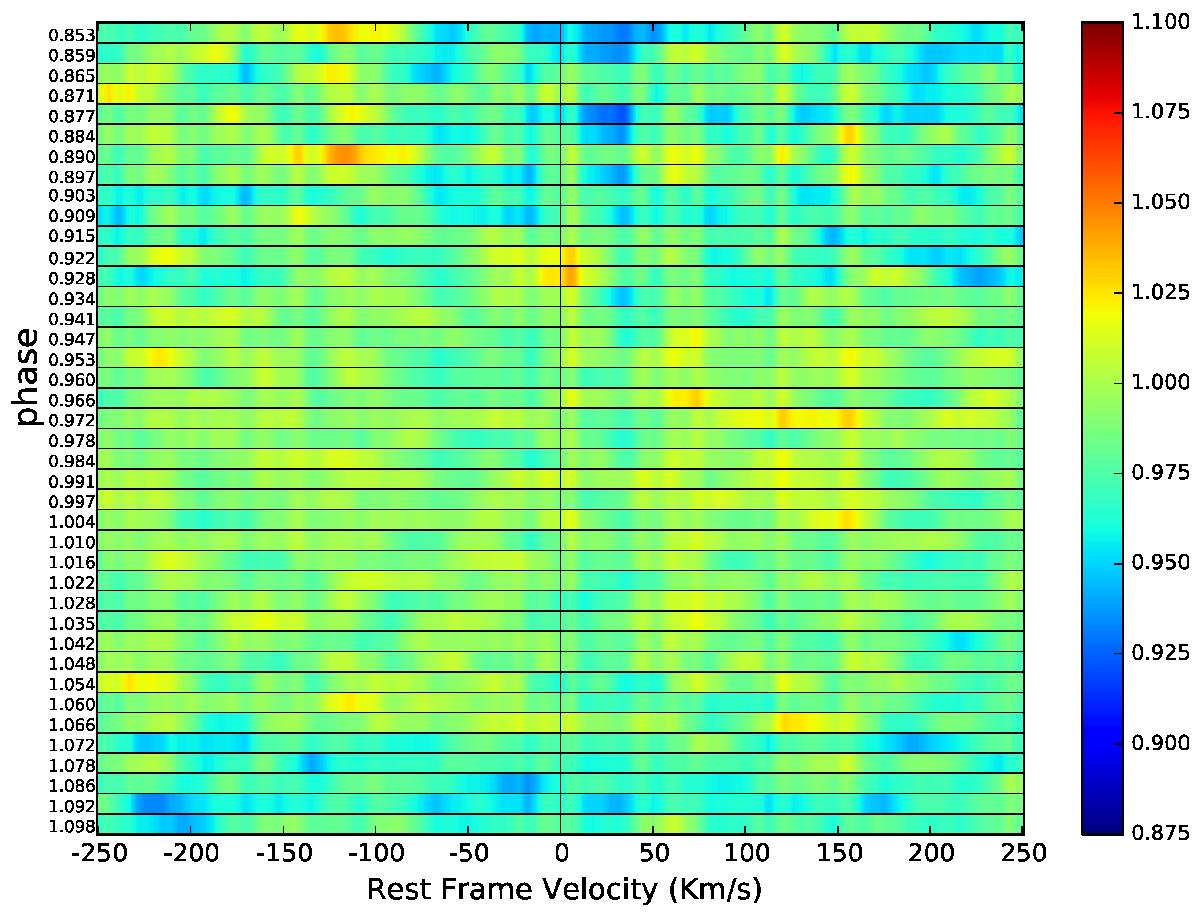
Time series of the He I λ6678.16 line of RR Lyr. Weak emission on two successive spectra at ϕ = 0.922 and ϕ = 0.928 is present i.e., when Hα and D3 show their maximum emission intensity. There is not post-maximum emission unlike the D3 line.
Current usage metrics show cumulative count of Article Views (full-text article views including HTML views, PDF and ePub downloads, according to the available data) and Abstracts Views on Vision4Press platform.
Data correspond to usage on the plateform after 2015. The current usage metrics is available 48-96 hours after online publication and is updated daily on week days.
Initial download of the metrics may take a while.