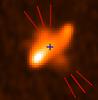
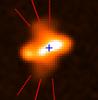
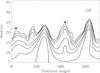
Fig. 6
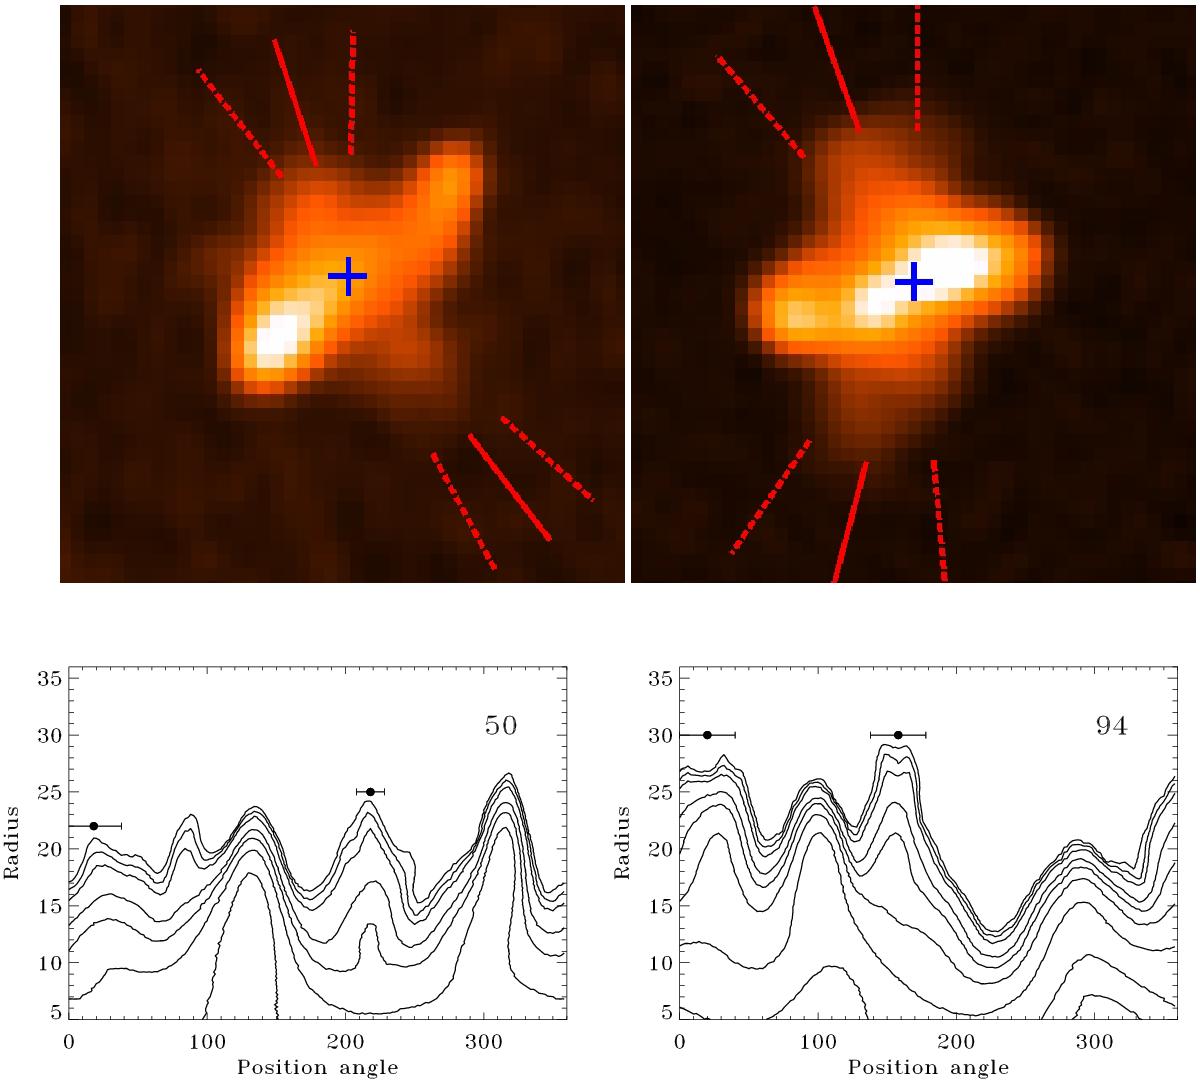
Top panels: FIRST images of two XRSs (XRS 50 and XRS 94, on the left and right side, respectively) graphically showing the errors in the measurement of the wings PA. The solid red line indicates the central value, the dashed ones differ by the estimated errors, i.e., 20°, except for the SW wing of XRS 50, where the error is 10°. Bottom panels: polar diagrams with the wings PA values and errors indicated.
Current usage metrics show cumulative count of Article Views (full-text article views including HTML views, PDF and ePub downloads, according to the available data) and Abstracts Views on Vision4Press platform.
Data correspond to usage on the plateform after 2015. The current usage metrics is available 48-96 hours after online publication and is updated daily on week days.
Initial download of the metrics may take a while.