Fig. 12
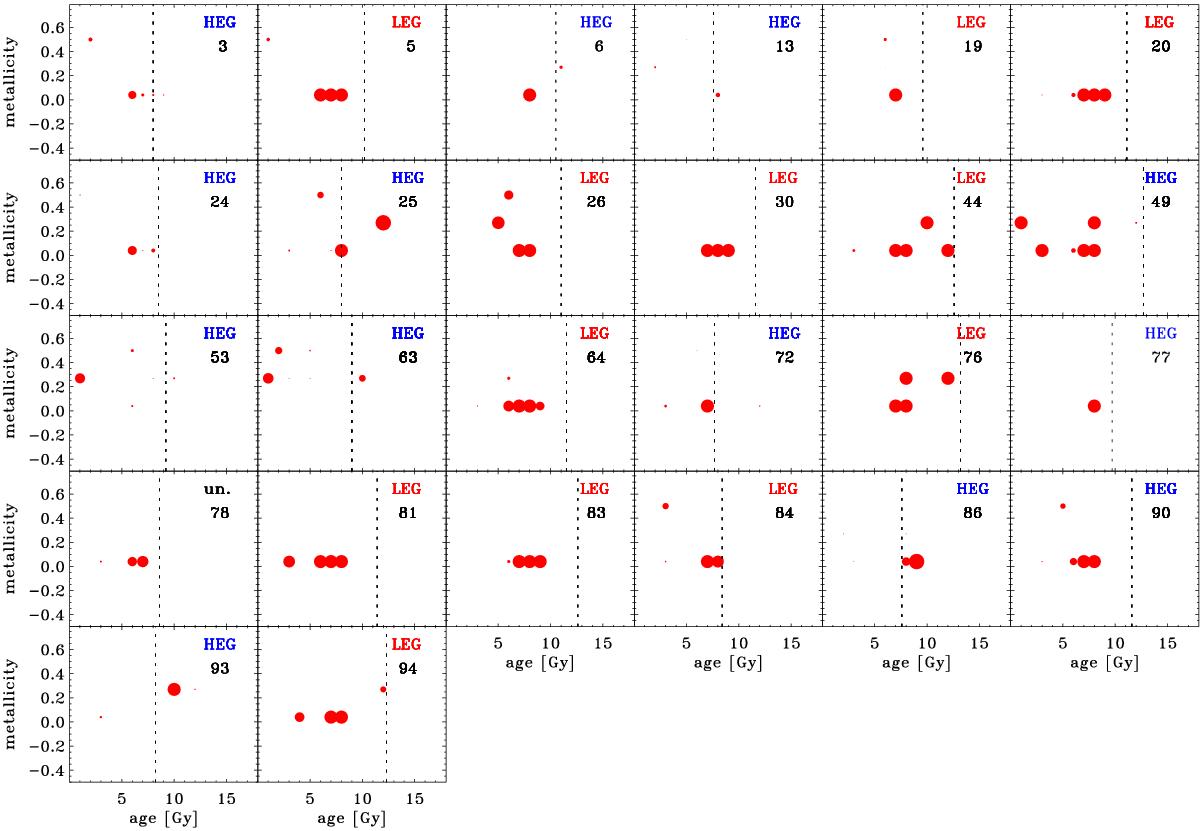
Decomposition of the starlight emission in various templates of stellar populations obtained with Gandalf. For each source we show the contribution of the 39 models used, formed by combining set with three different metalicity (Y axis) and 13 different ages (X axis). The area of the symbols show the relative contribution of each template. The dashed vertical line marks the age of the Universe at the redshift of each source.
Current usage metrics show cumulative count of Article Views (full-text article views including HTML views, PDF and ePub downloads, according to the available data) and Abstracts Views on Vision4Press platform.
Data correspond to usage on the plateform after 2015. The current usage metrics is available 48-96 hours after online publication and is updated daily on week days.
Initial download of the metrics may take a while.