Fig. 10
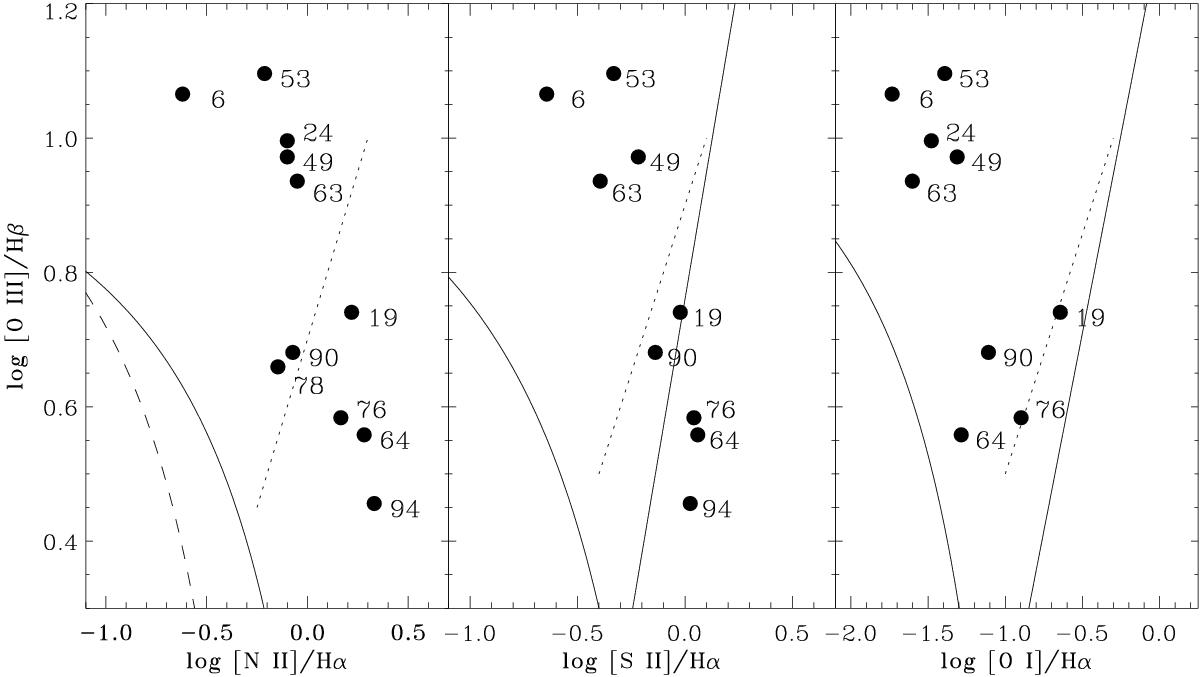
Spectroscopic diagnostic diagrams: (left) [O III]/Hβ vs. [N II]/Hα ratios, (center) [O III]/Hβ vs. [S II]/Hα ratio, (right) [O III]/Hβ vs. [O I]/Hα. The curves divide AGN (above the solid curved line) from star-forming galaxies. In the left panel, between the long-dashed and solid curve are the composite galaxies (Kewley et al. 2006). In the middle and right panels, the straight solid line divides Seyferts (upper left region) from LINERs (right region). The dashed lines mark the approximate boundaries between HEGs and LEGs derived from the 3CR radio-galaxies in each diagram, from Buttiglione et al. (2010), Fig. 7.
Current usage metrics show cumulative count of Article Views (full-text article views including HTML views, PDF and ePub downloads, according to the available data) and Abstracts Views on Vision4Press platform.
Data correspond to usage on the plateform after 2015. The current usage metrics is available 48-96 hours after online publication and is updated daily on week days.
Initial download of the metrics may take a while.