Fig. 6
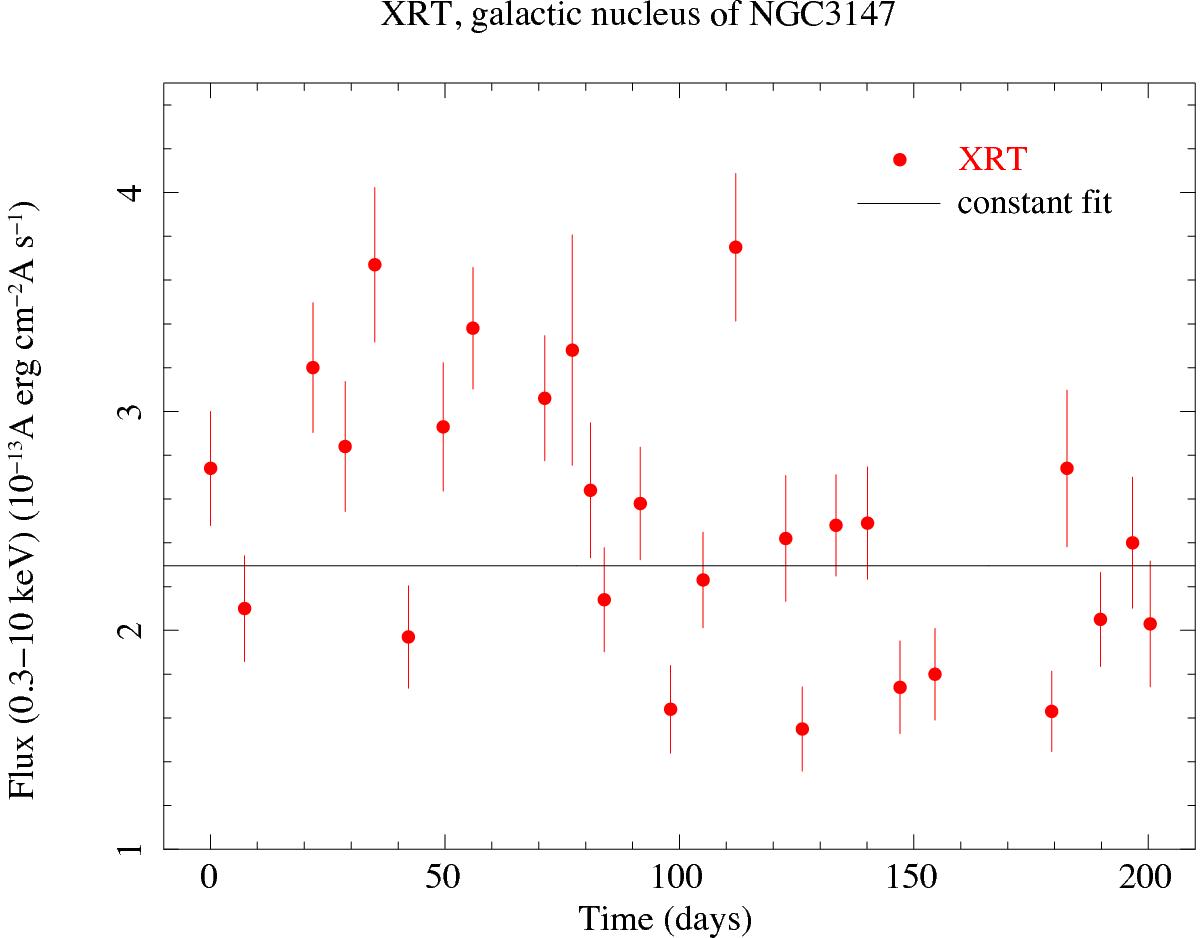
X-ray light curve of the AGN (Ptak et al. 1996) of NGC 3147 (NGC 3147-I1). We detected enough photons from this source to build a spectrum at each epoch and convert the count rate to flux. The spectral indexes found at each epoch are listed in Table A.7. The time zero is set to MET = 409627840 s (2013-12-25). The mean flux is 2.3 × 10⁻¹³ erg cm-2 s-1. The fit with a constant gives χ2 = 141.6 (26 d.o.f.) and a null probability. The UV counterpart of this source is not significantly variable.
Current usage metrics show cumulative count of Article Views (full-text article views including HTML views, PDF and ePub downloads, according to the available data) and Abstracts Views on Vision4Press platform.
Data correspond to usage on the plateform after 2015. The current usage metrics is available 48-96 hours after online publication and is updated daily on week days.
Initial download of the metrics may take a while.