Fig. 8
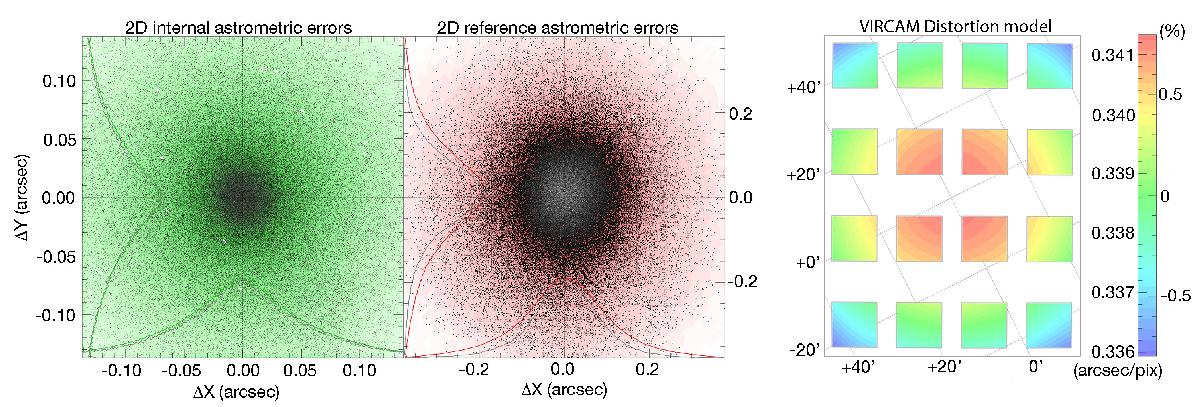
Verification plots created by Scamp for all data on Orion A in the KS band. The two figures on the left show the 2-dimensional internal and external dispersions in the astrometric matching procedure. The symmetry of the Gaussian-shaped distributions indicates that the remaining systematic errors are negligible compared to other noise terms. The typical global errors (rms) were found around 40 mas internally and 70 mas with respect to the reference catalog. The plot on the righthand side shows the derived distortion model of VIRCAM, where the color indicates the variation in pixel scale across the focal plane. Only very small distortion levels are seen with an amplitude of ~2% from the center to the edge.
Current usage metrics show cumulative count of Article Views (full-text article views including HTML views, PDF and ePub downloads, according to the available data) and Abstracts Views on Vision4Press platform.
Data correspond to usage on the plateform after 2015. The current usage metrics is available 48-96 hours after online publication and is updated daily on week days.
Initial download of the metrics may take a while.