Fig. 7
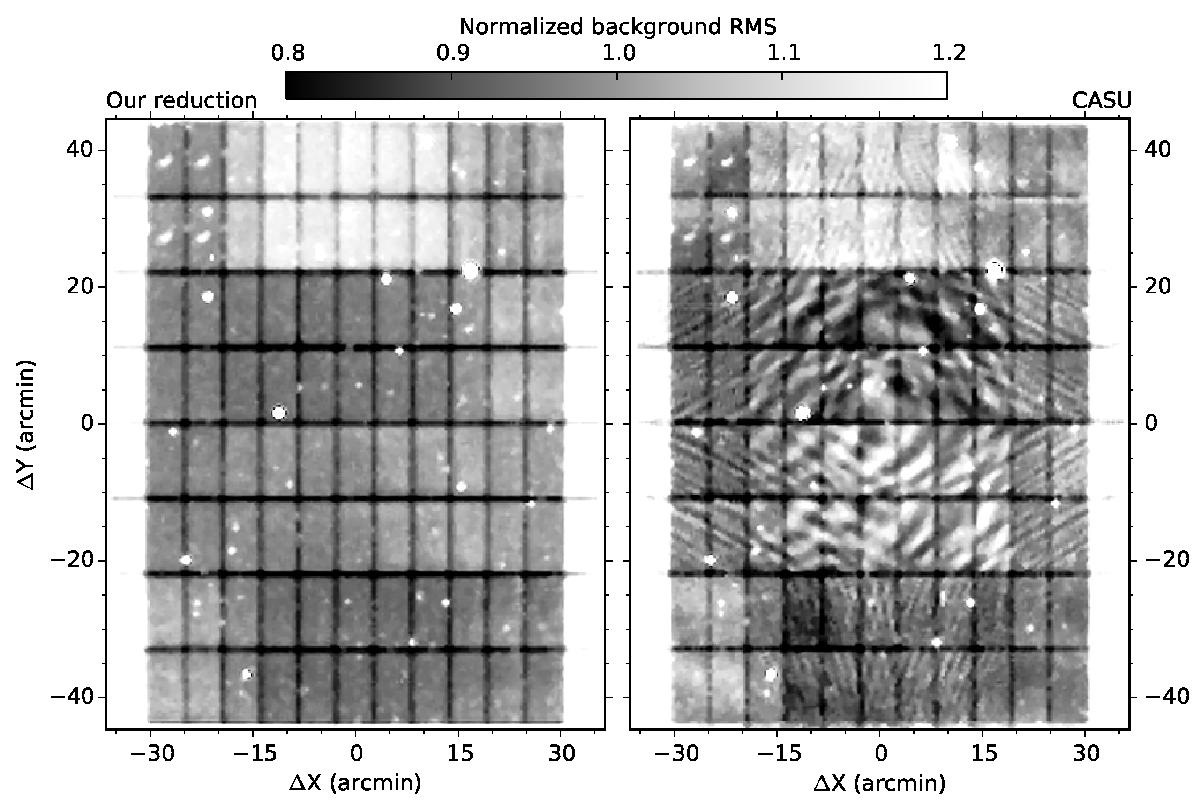
Noise rms maps of the CF in KS for our reduction and the CASU pipeline. The bilinear interpolation and the radial distortion model clearly leave spatially correlated noise in the tiled images. On the other hand, the variance in our reduction is only dominated by detector coverage and intrinsic detector characteristics. No sources were masked prior to noise calculations.
Current usage metrics show cumulative count of Article Views (full-text article views including HTML views, PDF and ePub downloads, according to the available data) and Abstracts Views on Vision4Press platform.
Data correspond to usage on the plateform after 2015. The current usage metrics is available 48-96 hours after online publication and is updated daily on week days.
Initial download of the metrics may take a while.