Fig. 6
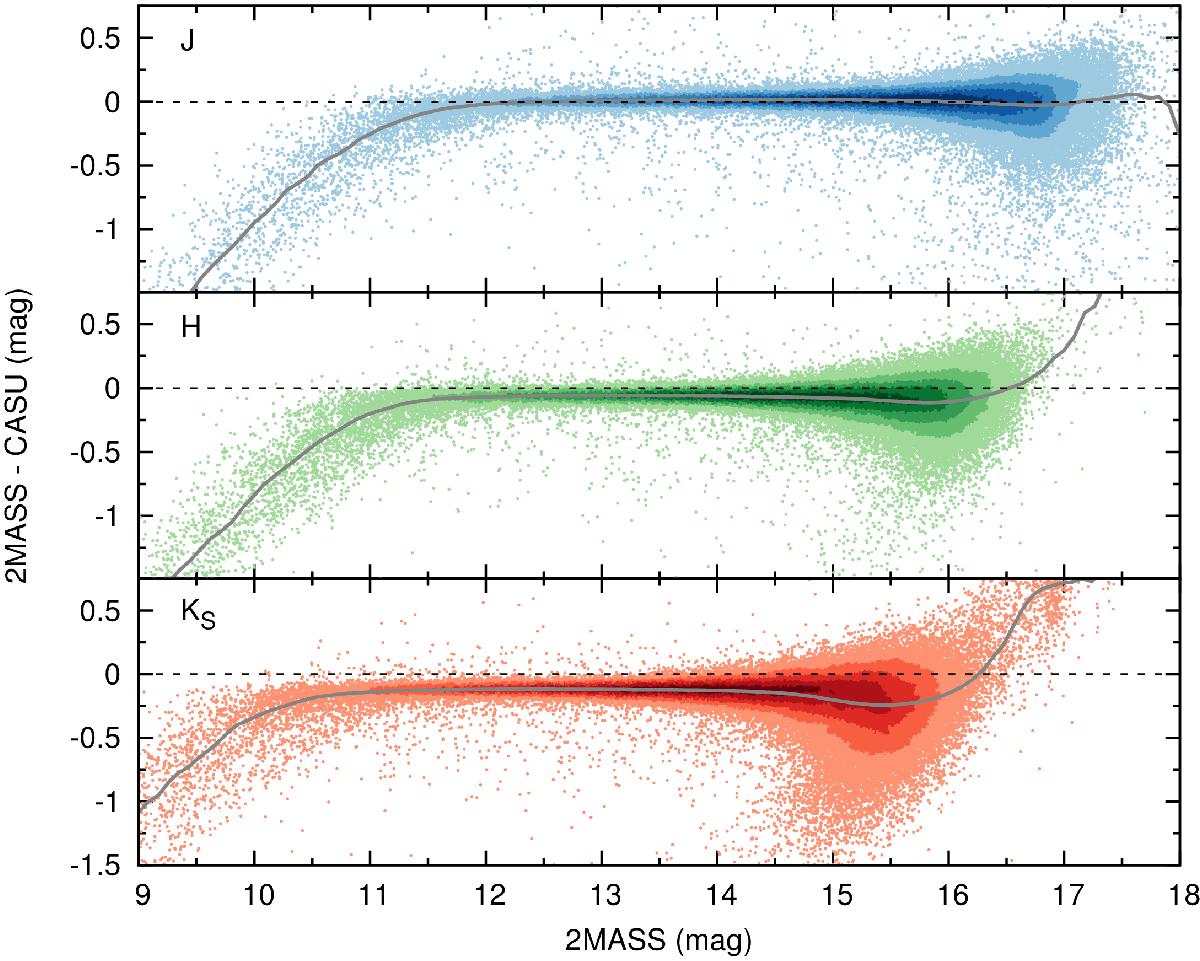
Difference in the photometry between the CASU default reduction and the 2MASS catalog. The blue, green, and red data points show the J, H, and KS bands, respectively. The color shading represents source density in a 0.2 × 0.05 box in the given parameter space and the gray solid line a running median along the abscissa with a box width of 0.5 mag. Several processing steps contribute to the apparent offsets, which are all avoided in our data reduction.
Current usage metrics show cumulative count of Article Views (full-text article views including HTML views, PDF and ePub downloads, according to the available data) and Abstracts Views on Vision4Press platform.
Data correspond to usage on the plateform after 2015. The current usage metrics is available 48-96 hours after online publication and is updated daily on week days.
Initial download of the metrics may take a while.