Fig. 11
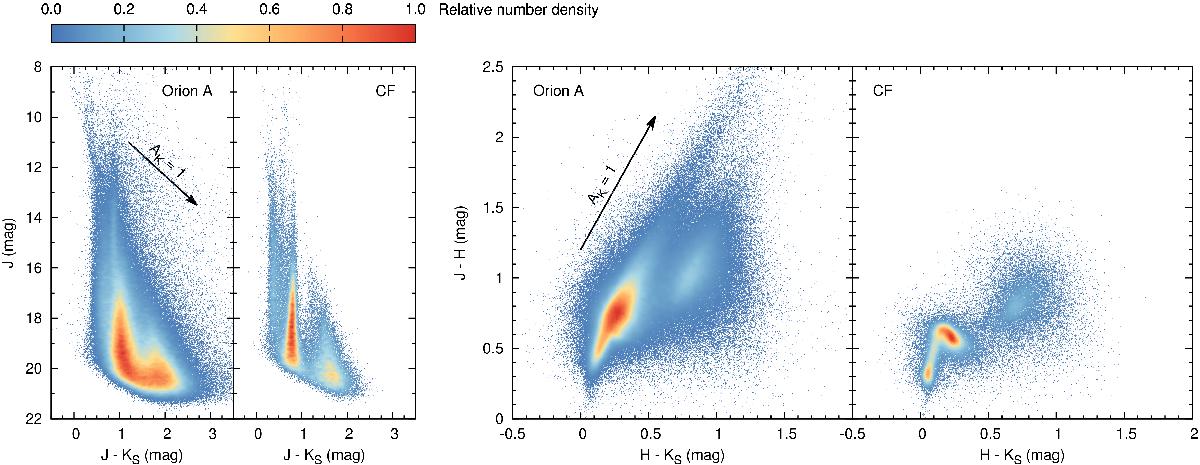
Color−magnitude and color−color diagrams for both the Orion A and the CF data. The colors indicate normalized source density within a 0.1 × 0.1 mag box in the J vs. J−KS parameter space and 0.02 × 0.02 mag in J−H vs. H−KS. The black arrows indicate the effect of an extinction of 1 mag in KS. The presence of heavy dust extinction in Orion A pushes many sources toward redder colors when compared to the CF, which itself has a clearly defined main-sequence (0.2 ≲ J−KS ≲ 1.2, 0 ≲ H−KS ≲ 0.4) and galaxy locus (1.2 ≲ J−KS ≲ 2.2, 0.5 ≲ H−KS ≲ 1.2) in both diagrams.
Current usage metrics show cumulative count of Article Views (full-text article views including HTML views, PDF and ePub downloads, according to the available data) and Abstracts Views on Vision4Press platform.
Data correspond to usage on the plateform after 2015. The current usage metrics is available 48-96 hours after online publication and is updated daily on week days.
Initial download of the metrics may take a while.