Fig. 7
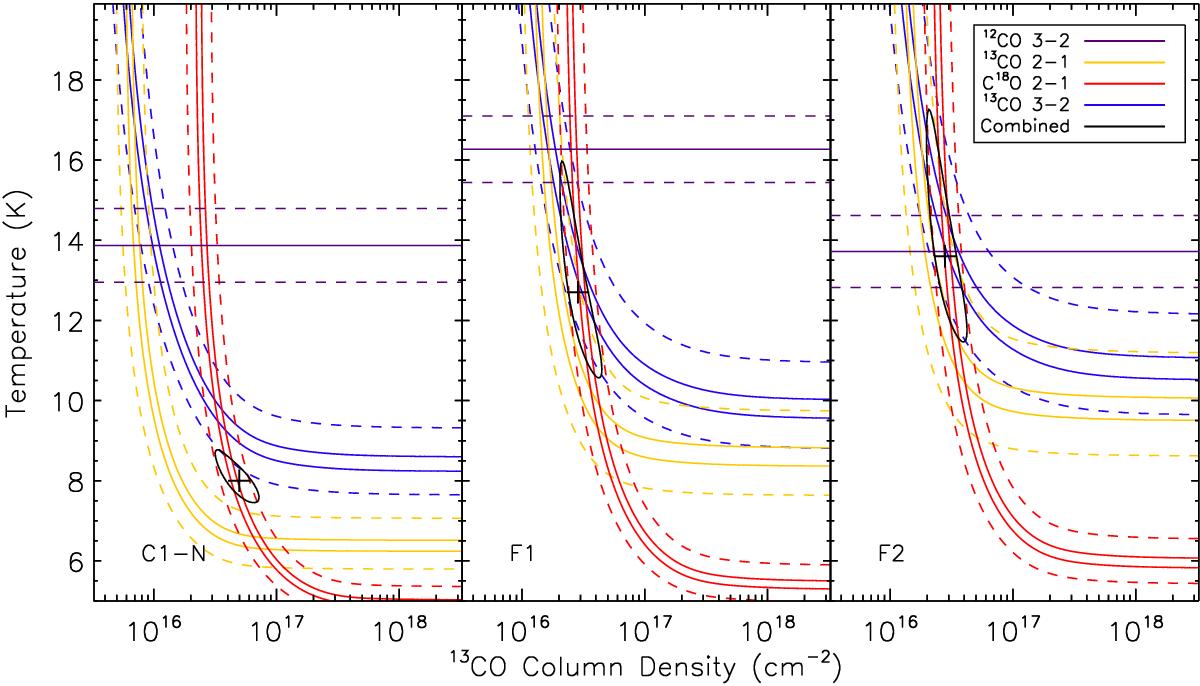
Best fitting gas kinetic temperature and 13CO column density ranges for the observed integrated intensities towards C1-N (left), F1 (centre), and F2 (right) based on RADEX modelling. The solid yellow, red, and blue lines show the models where the integrated intensities of the 13CO J = 2 → 1, C18O J = 2 → 1, and 13CO J = 3 → 2, respectively, were within 5% of the observed values. The dashed yellow, red, and blue lines show where the models were within 25% of the observed integrated intensities of the above three lines individually. The solid black ellipse shows the 1-sigma uncertainty range for models that match all three lines, found by the locus of models with a χ2 value within 1 of the best fitting model. The black cross indicates the best fitting model. The solid horizontal purple line gives the 12CO J = 3 → 2 derived temperature while the dashed purple lines give the uncertainty on this temperature.
Current usage metrics show cumulative count of Article Views (full-text article views including HTML views, PDF and ePub downloads, according to the available data) and Abstracts Views on Vision4Press platform.
Data correspond to usage on the plateform after 2015. The current usage metrics is available 48-96 hours after online publication and is updated daily on week days.
Initial download of the metrics may take a while.