Fig. 5
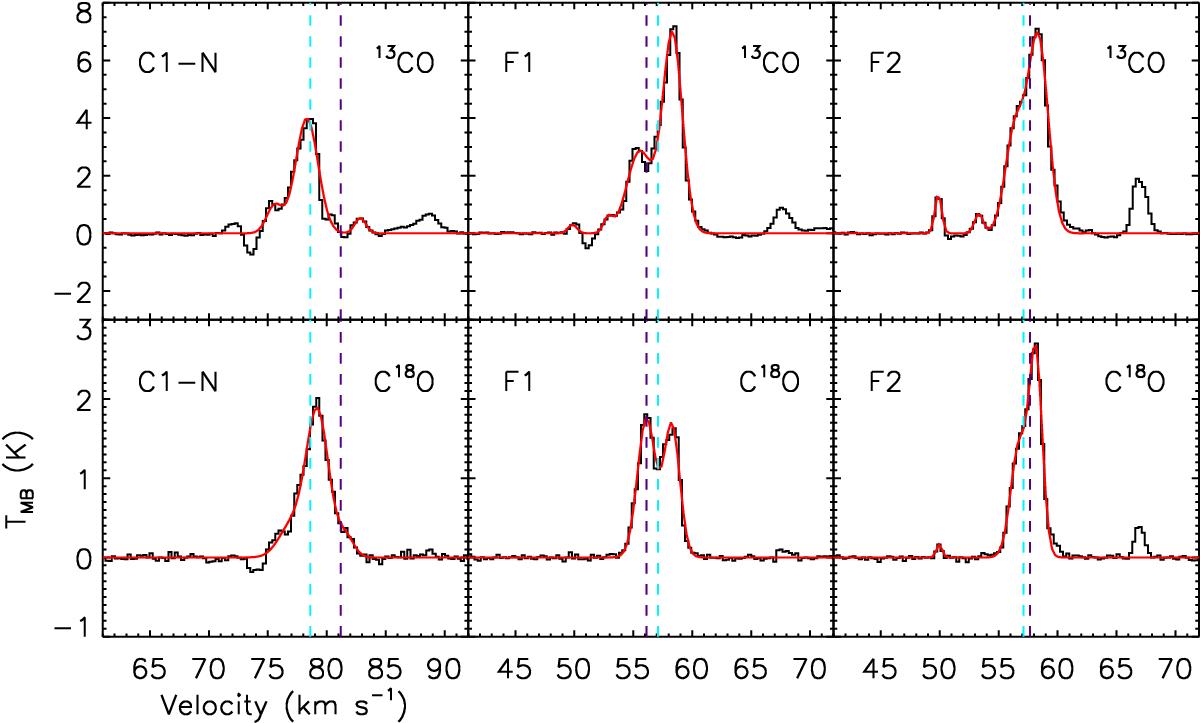
IRAM 30 m 13CO and C18O J = 2 → 1 spectra towards the C1-N, F1, and F2 cores. The red lines show the best fits to the data. The cores are labelled in the top left of each spectral window and the isotopologue in the top right. The vertical, dashed, dark purple lines give the central velocity of the N2D+J = 3 → 2 line detected towards the cores (Tan et al. 2013) while the dashed, light blue lines give the central velocities of the parent IRDCs (Simon et al. 2006).
Current usage metrics show cumulative count of Article Views (full-text article views including HTML views, PDF and ePub downloads, according to the available data) and Abstracts Views on Vision4Press platform.
Data correspond to usage on the plateform after 2015. The current usage metrics is available 48-96 hours after online publication and is updated daily on week days.
Initial download of the metrics may take a while.