Fig. 4
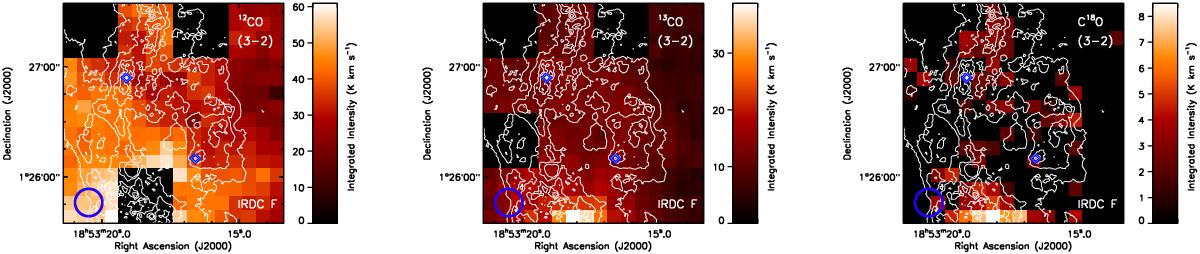
Total integrated intensities for all detected components of the 12CO (left), 13CO (centre), and C18O (right) J = 3 → 2 lines towards IRDC F by the JCMT (in color scale). The contours give the mass surface density derived by Butler & Tan (2012) and are the same as in Fig. 1. The blue diamonds give the central locations of the F1 and F2 cores (right and left in the subfigures, respectively). The blue circle shows the HPBW of the observations.
Current usage metrics show cumulative count of Article Views (full-text article views including HTML views, PDF and ePub downloads, according to the available data) and Abstracts Views on Vision4Press platform.
Data correspond to usage on the plateform after 2015. The current usage metrics is available 48-96 hours after online publication and is updated daily on week days.
Initial download of the metrics may take a while.