Fig. 2
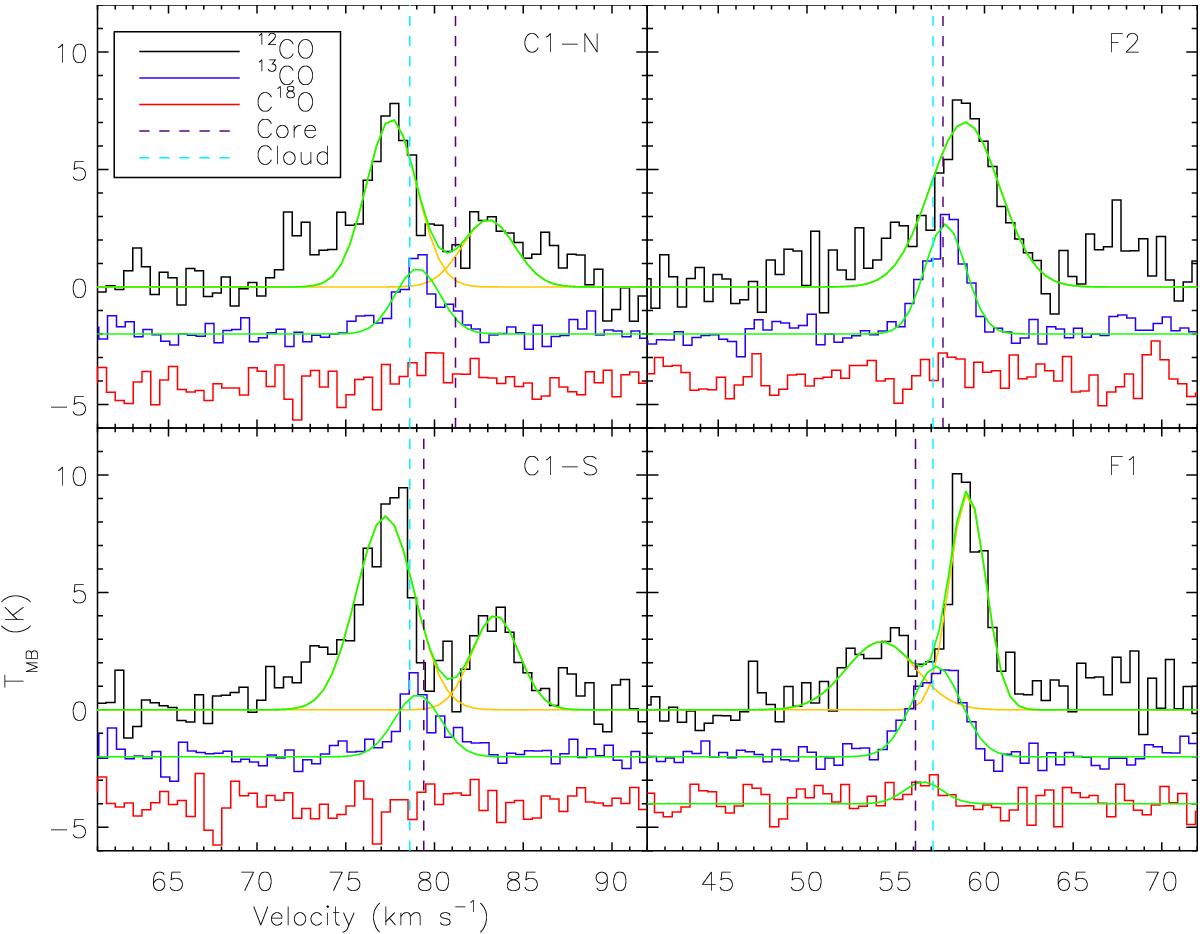
JCMT spectra towards the central positions of the C1-N, C1-S, F1, and F2 cores with the cores labelled in the top right hand corner of the spectral boxes. All spectra are for the J = 3 → 2 transition with the black showing the 12CO data, the blue showing the 13CO data shifted down by 2 K, and the red showing the C18O data shifted down by 4 K. For each spectrum, the green lines show the cumulative best fit of all of the components within the velocity range defined for the appropriate cloud, while the yellow line shows the individual components contributing to the fit. The vertical, dashed, dark purple lines give the central velocity of the N2D+J = 3 → 2 line detected towards the cores (Tan et al. 2013), while the dashed, light blue lines give the central velocities of the parent IRDCs (Simon et al. 2006).
Current usage metrics show cumulative count of Article Views (full-text article views including HTML views, PDF and ePub downloads, according to the available data) and Abstracts Views on Vision4Press platform.
Data correspond to usage on the plateform after 2015. The current usage metrics is available 48-96 hours after online publication and is updated daily on week days.
Initial download of the metrics may take a while.