Fig. 14
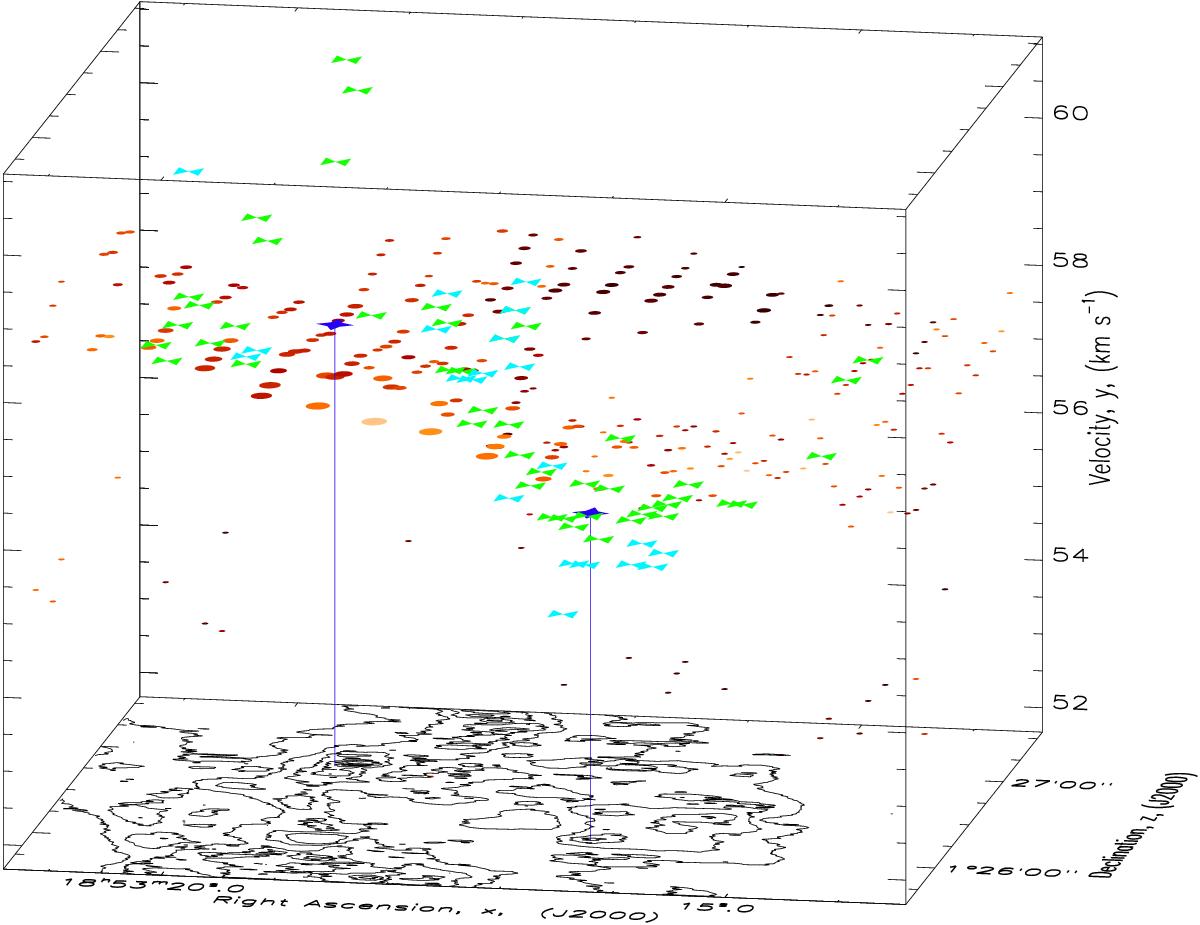
Right ascension-declination-velocity diagram for the detected lines towards IRDC F. The circular points shaded from black to light orange are the 13CO components detected by the JCMT. For these JCMT points, the size of the point is scaled to the peak intensity with larger points corresponding to larger intensities, while the colour is scaled based upon the FWHM with lighter colours denoting larger FWHM. The bow-tie shaped green and light blue points (cubes in the interactive view) show the 12CO J = 8 → 7 and 9 → 8 lines detected by Herschel (Paper I), while the dark blue, star shaped points (cones in the interactive view) are the N2D+J = 3 → 2 detections of the F1 and F2 cores by Tan et al. (2013). The F2 core is the core at the larger declination and with the larger centroid velocity. A line has been drawn connecting the N2D+ points to the lower surface to better illustrate the position of the cores. The contours shown on the bottom surface are the mass surface density contours from Butler & Tan (2012). If the electronic version is viewed with Adobe Acrobat, the figure can be clicked on to activate an interactive, rotatable, 3D representation of the data. In this interactive view, the X-axis is increasing right ascension, the Z-axis is increasing declination, and the Y-axis is increasing central velocity. Right clicking and selecting disable content will return to the original static, 2D representation of the data.
Current usage metrics show cumulative count of Article Views (full-text article views including HTML views, PDF and ePub downloads, according to the available data) and Abstracts Views on Vision4Press platform.
Data correspond to usage on the plateform after 2015. The current usage metrics is available 48-96 hours after online publication and is updated daily on week days.
Initial download of the metrics may take a while.