Fig. 12
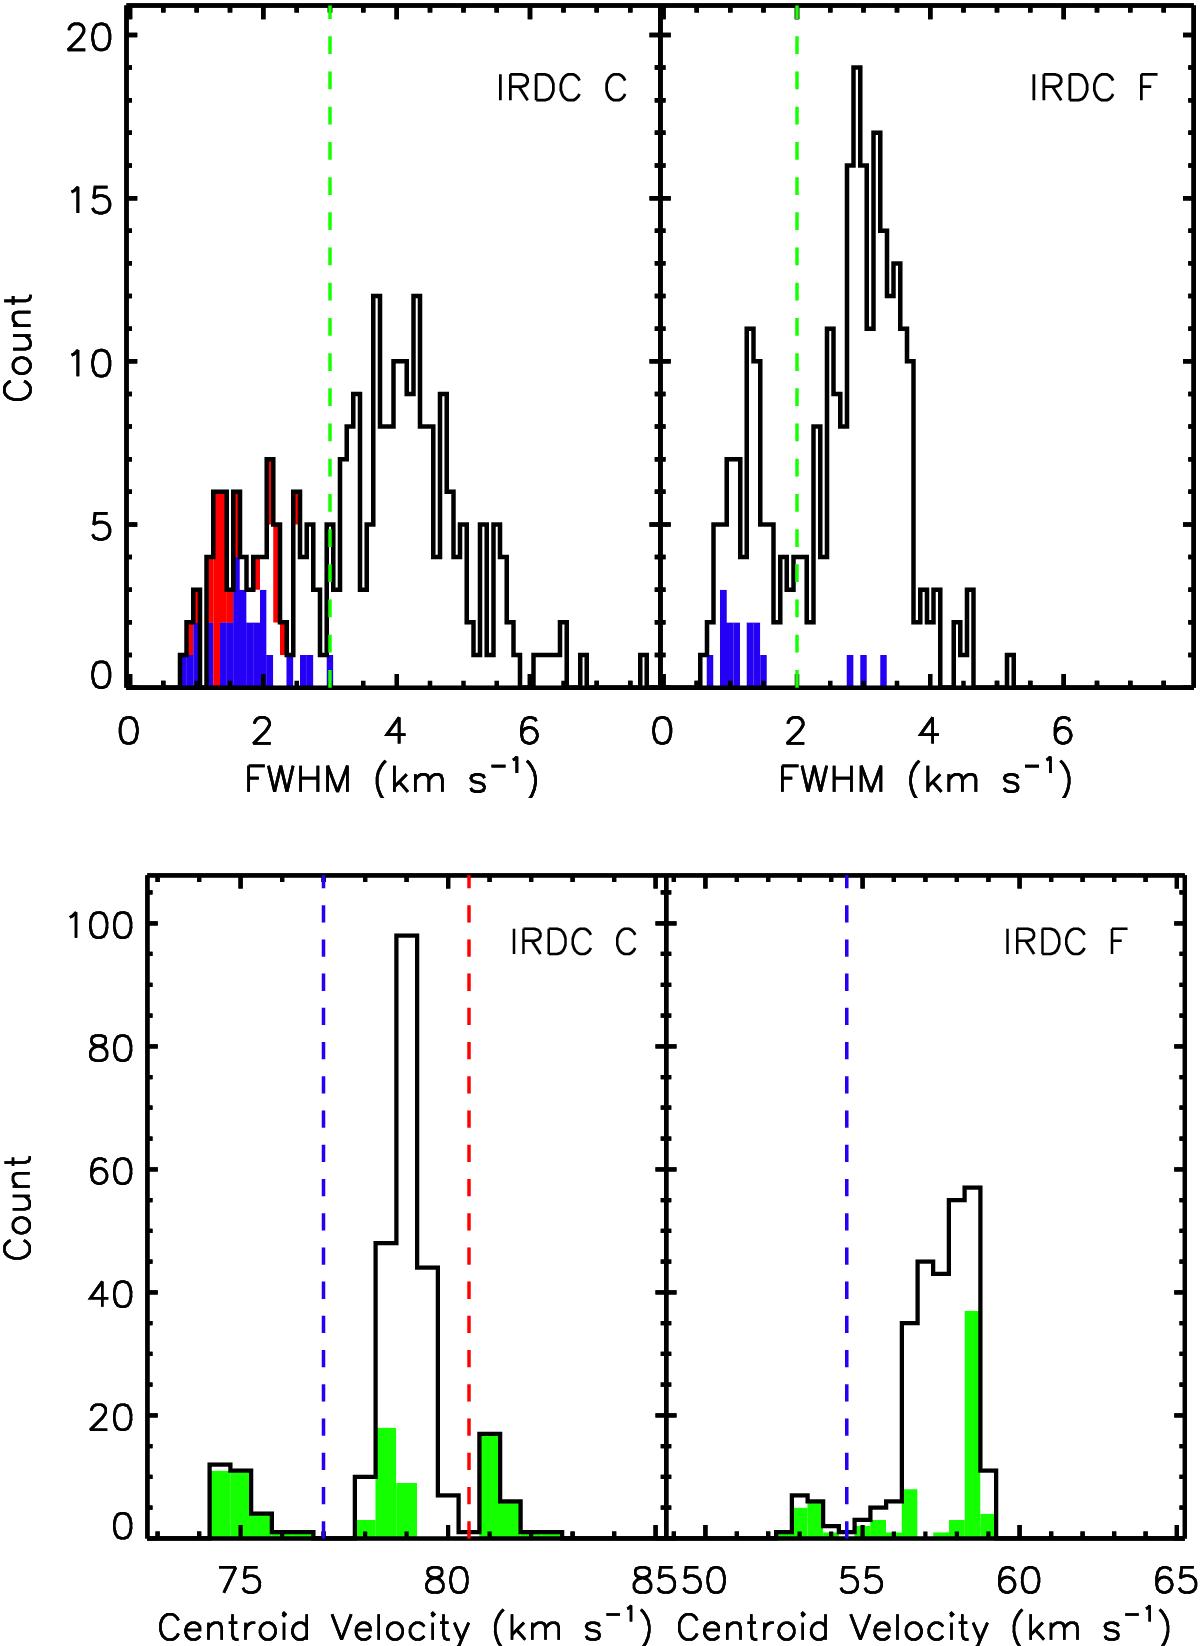
Histograms of the occurrence of different FWHM (top) and centroid velocity (bottom) of the different detected line components of 13CO J = 3 → 2. The left column is for IRDC C and the right column for IRDC F. In the FWHM histogram for IRDC C, components with centroid velocities greater than 80.5 km s-1 are shown in light red, velocities less than 77 km s-1 in dark blue, and intermediate velocities in white. For IRDC F, in the FWHM histogram, components with centroid velocities less than 54.5 km s-1 are shown in blue. These threshold velocities are denoted as dashed vertical lines in the bottom panels in the corresponding colours. For the VLSR histograms, components with a FWHM less than 3 km s-1 in IRDC C and less than 2 km s-1 in IRDC F are shown in green. This dividing width is denoted as the vertical green line in the top panels.
Current usage metrics show cumulative count of Article Views (full-text article views including HTML views, PDF and ePub downloads, according to the available data) and Abstracts Views on Vision4Press platform.
Data correspond to usage on the plateform after 2015. The current usage metrics is available 48-96 hours after online publication and is updated daily on week days.
Initial download of the metrics may take a while.