Fig. 1
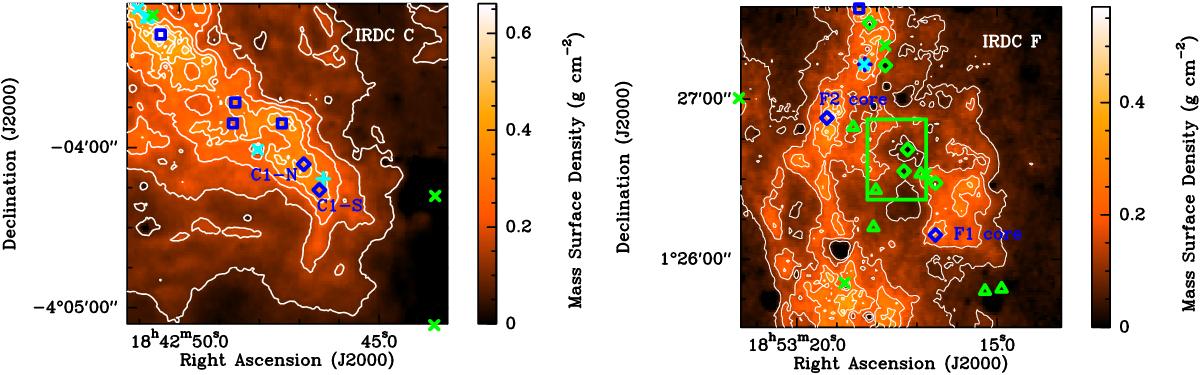
Mass surface density derived by Butler & Tan (2012) for the C1 clump (left) and F1 and F2 clumps (right). The contours start at 0.075 g cm-2 (AV of 17 mag) and increase by increments of 0.075 g cm-2 with the typical uncertainty being of the order of 30% based upon uncertainties in the opacity per unit mass (Butler & Tan 2009, 2012). The uncertainty based upon background fluctuations is of the order of 0.013 g cm-2 (Butler & Tan 2012). The dark blue diamonds give the central locations of the C1-N, C1-S, F1, and F2 cores, as determined from the N2D+ ALMA observations of Tan et al. (2013). The dark blue squares give the locations of extinction cores identified by Butler et al. (2014). The central location of the Butler et al. (2014) C1 clump is not shown in lieu of the Tan et al. (2013) locations. The light blue X’s indicate the positions of water masers (Wang et al. 2006, 2012; Chambers et al. 2009) while the light blue cross indicates the position of the water maser detected at 59 km s-1 by Wang et al. (2006) but not detected by the more sensitive survey of Chambers et al. (2009). The green X’s indicate the positions of 70 μm sources from the HiGAL survey (Molinari et al. 2010). The green diamonds indicate positions of objects that were well fitted as young stellar objects (YSOs) by Shepherd et al. (2007). The green triangles are 24 μm sources that are likely YSOs, but which could also be asymptotic giant branch stars since they are only detected in two or less of the IRAC+2MASS bands (Shepherd et al. 2007). The green rectangle indicates the location of a near-infrared source overdensity (overdensity A), interpreted by Foster et al. (2014) as an embedded low mass protostar population. The right ascension for this overdensity given in Table 3 of Foster et al. (2014) is incorrect (Foster, pers. comm.) and we use a right ascension of ![]() (J2000), not
(J2000), not ![]() (J2000), for this overdensity. The regions shown are the regions mapped by the JCMT.
(J2000), for this overdensity. The regions shown are the regions mapped by the JCMT.
Current usage metrics show cumulative count of Article Views (full-text article views including HTML views, PDF and ePub downloads, according to the available data) and Abstracts Views on Vision4Press platform.
Data correspond to usage on the plateform after 2015. The current usage metrics is available 48-96 hours after online publication and is updated daily on week days.
Initial download of the metrics may take a while.