Fig. 6
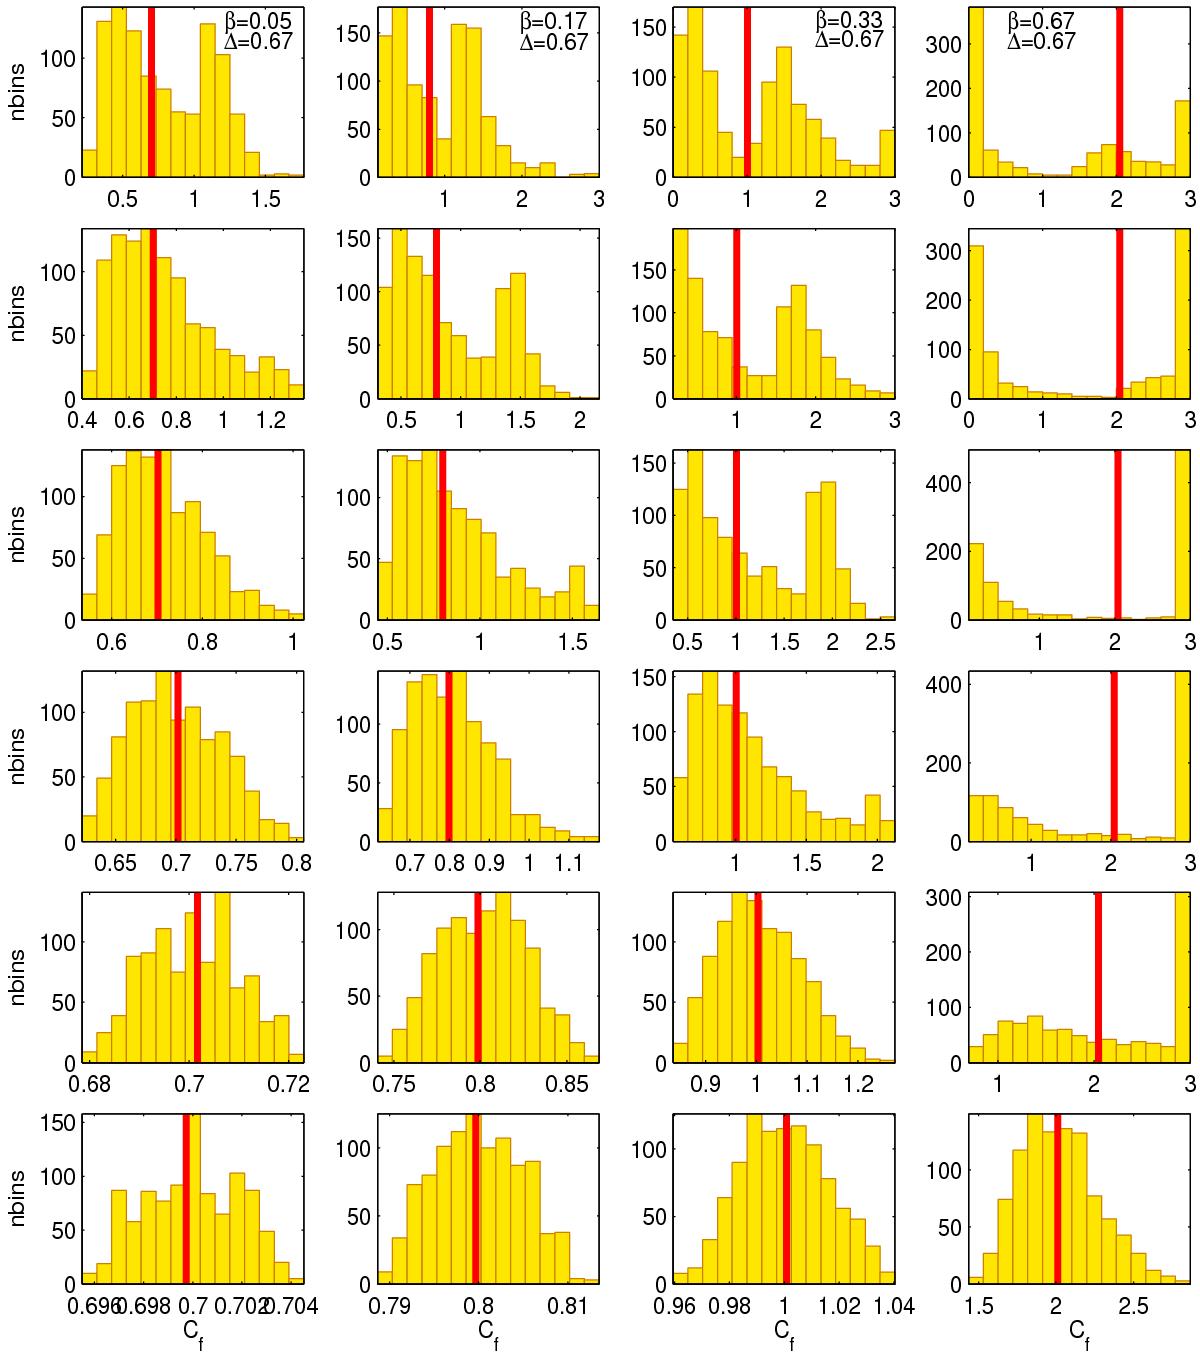
Role of β (columns) and accuracy (rows) of associated Zp, for fixed Δ = 2/3. Shown are PDFs (y-axis) of Cf (x-axis), 1000 random data sets, powers p = 1,...,5 for β = 0.0476 (first column), β = 0.17 (second column), β = 1/3 (third column), and β = 2/3 (fourth column). Corresponding exact co-dimensions (red lines) are, from left to right: C = 0.7, C = 0.8, C = 1, and C = 2. Individual rows from top to bottom contain accuracies of 20%, 10%, 5%, 2%, 0.5%, and 0.1%. As can be seen, the larger β, the more severe are the consequences of inaccuracies in the Zp. Histograms in the upper right (large β, low accuracy of the Zp) look worst. We note that axis ranges differ among panels, to best capture the shape of each histogram.
Current usage metrics show cumulative count of Article Views (full-text article views including HTML views, PDF and ePub downloads, according to the available data) and Abstracts Views on Vision4Press platform.
Data correspond to usage on the plateform after 2015. The current usage metrics is available 48-96 hours after online publication and is updated daily on week days.
Initial download of the metrics may take a while.