Fig. 5
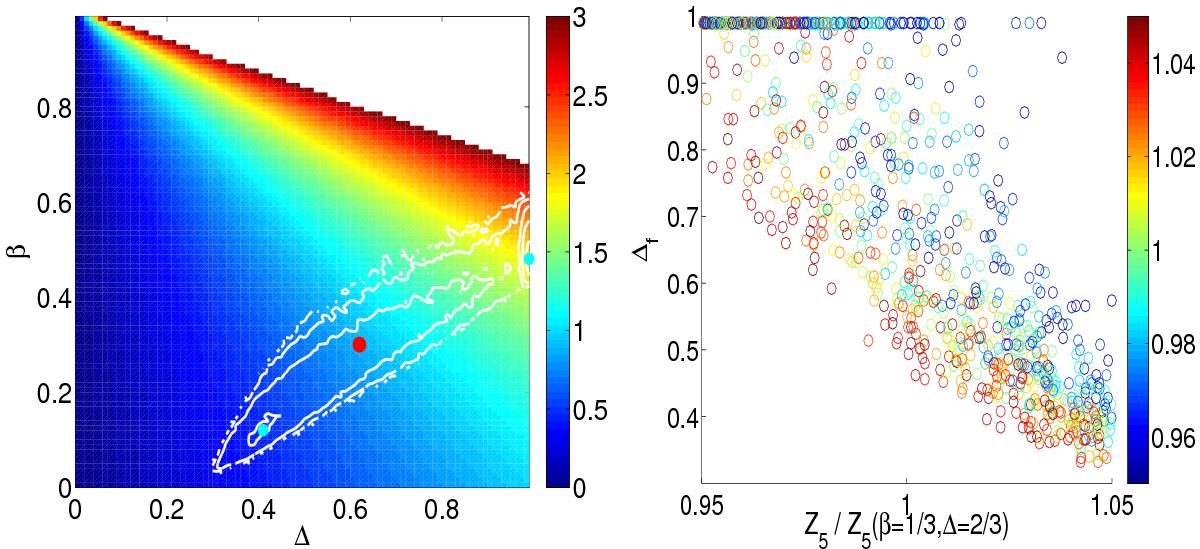
Best-fit βf and Δf from 5% perturbed Zp. Left: 2D histogram (contours, log10, spacing 0.5, spanning three orders of magnitude) of best-fit β-Δ-values from 100 000 perturbed data sets. We note that the 2D histogram shows two peak values (indicated by cyan dots), none of them co-located with the unperturbed (β = 1/3,Δ = 2/3) pair (red dot). Right: underestimation of Z5 favors Δf = 1. Shown is, for a subset of 1000 perturbed data sets, Δf as function of ![]() , again for an unperturbed pair (β = 1/3,Δ = 2/3). Colors indicate
, again for an unperturbed pair (β = 1/3,Δ = 2/3). Colors indicate ![]() .
.
Current usage metrics show cumulative count of Article Views (full-text article views including HTML views, PDF and ePub downloads, according to the available data) and Abstracts Views on Vision4Press platform.
Data correspond to usage on the plateform after 2015. The current usage metrics is available 48-96 hours after online publication and is updated daily on week days.
Initial download of the metrics may take a while.