Fig. 8
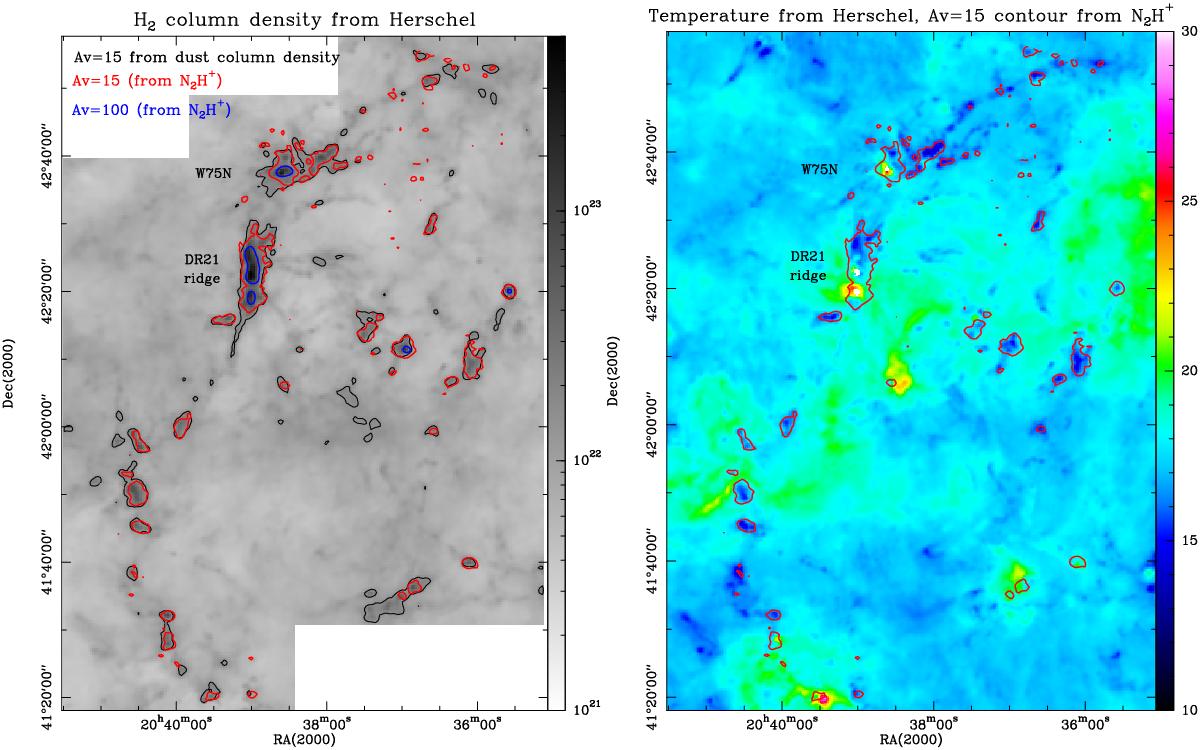
Left: foreground-corrected dust column-density map (as shown in Fig. 1) in greyscale. The black contour indicates the Av = 15 level. The red contours show the same Av = 15 level from the H2 column-density map derived from N2H+, using an excitation temperature of 10 K and an abundance of 2 × 10⁻⁹. Right: dust temperature map of Cygnus X North from Herschel with the same red Av = 15 contour from N2H+.
Current usage metrics show cumulative count of Article Views (full-text article views including HTML views, PDF and ePub downloads, according to the available data) and Abstracts Views on Vision4Press platform.
Data correspond to usage on the plateform after 2015. The current usage metrics is available 48-96 hours after online publication and is updated daily on week days.
Initial download of the metrics may take a while.