Fig. C.1
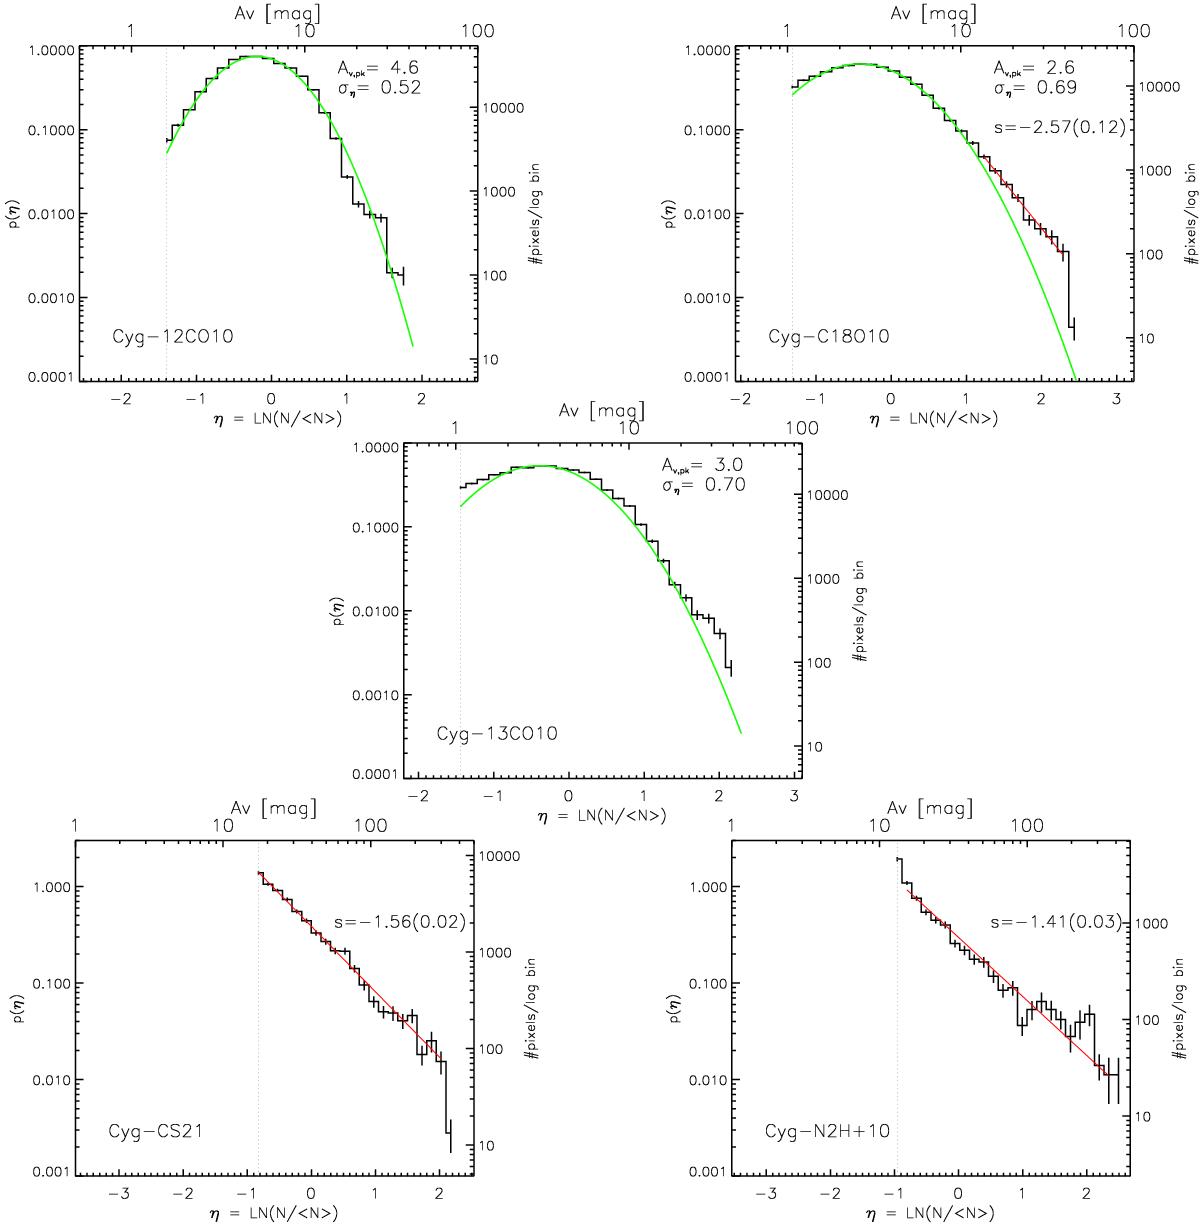
PDFs derived from the molecular line maps. The left y-axis gives the normalized probability p(η), the right y-axis the number of pixels per log bin. The upper x-axis is the visual extinction and the lower x-axis the logarithm of the normalized column density. For the CO lines, we fitted a lognormal to the low column-density range, indicated by a green curve. The red line shows the power-law fit to the high column-density end for C18O, CS, and N2H+. The respective slopes s (and errors) are given in the panels. For the CO lines, the peak and width of the PDF is indicated with Avpeak and σ.
Current usage metrics show cumulative count of Article Views (full-text article views including HTML views, PDF and ePub downloads, according to the available data) and Abstracts Views on Vision4Press platform.
Data correspond to usage on the plateform after 2015. The current usage metrics is available 48-96 hours after online publication and is updated daily on week days.
Initial download of the metrics may take a while.