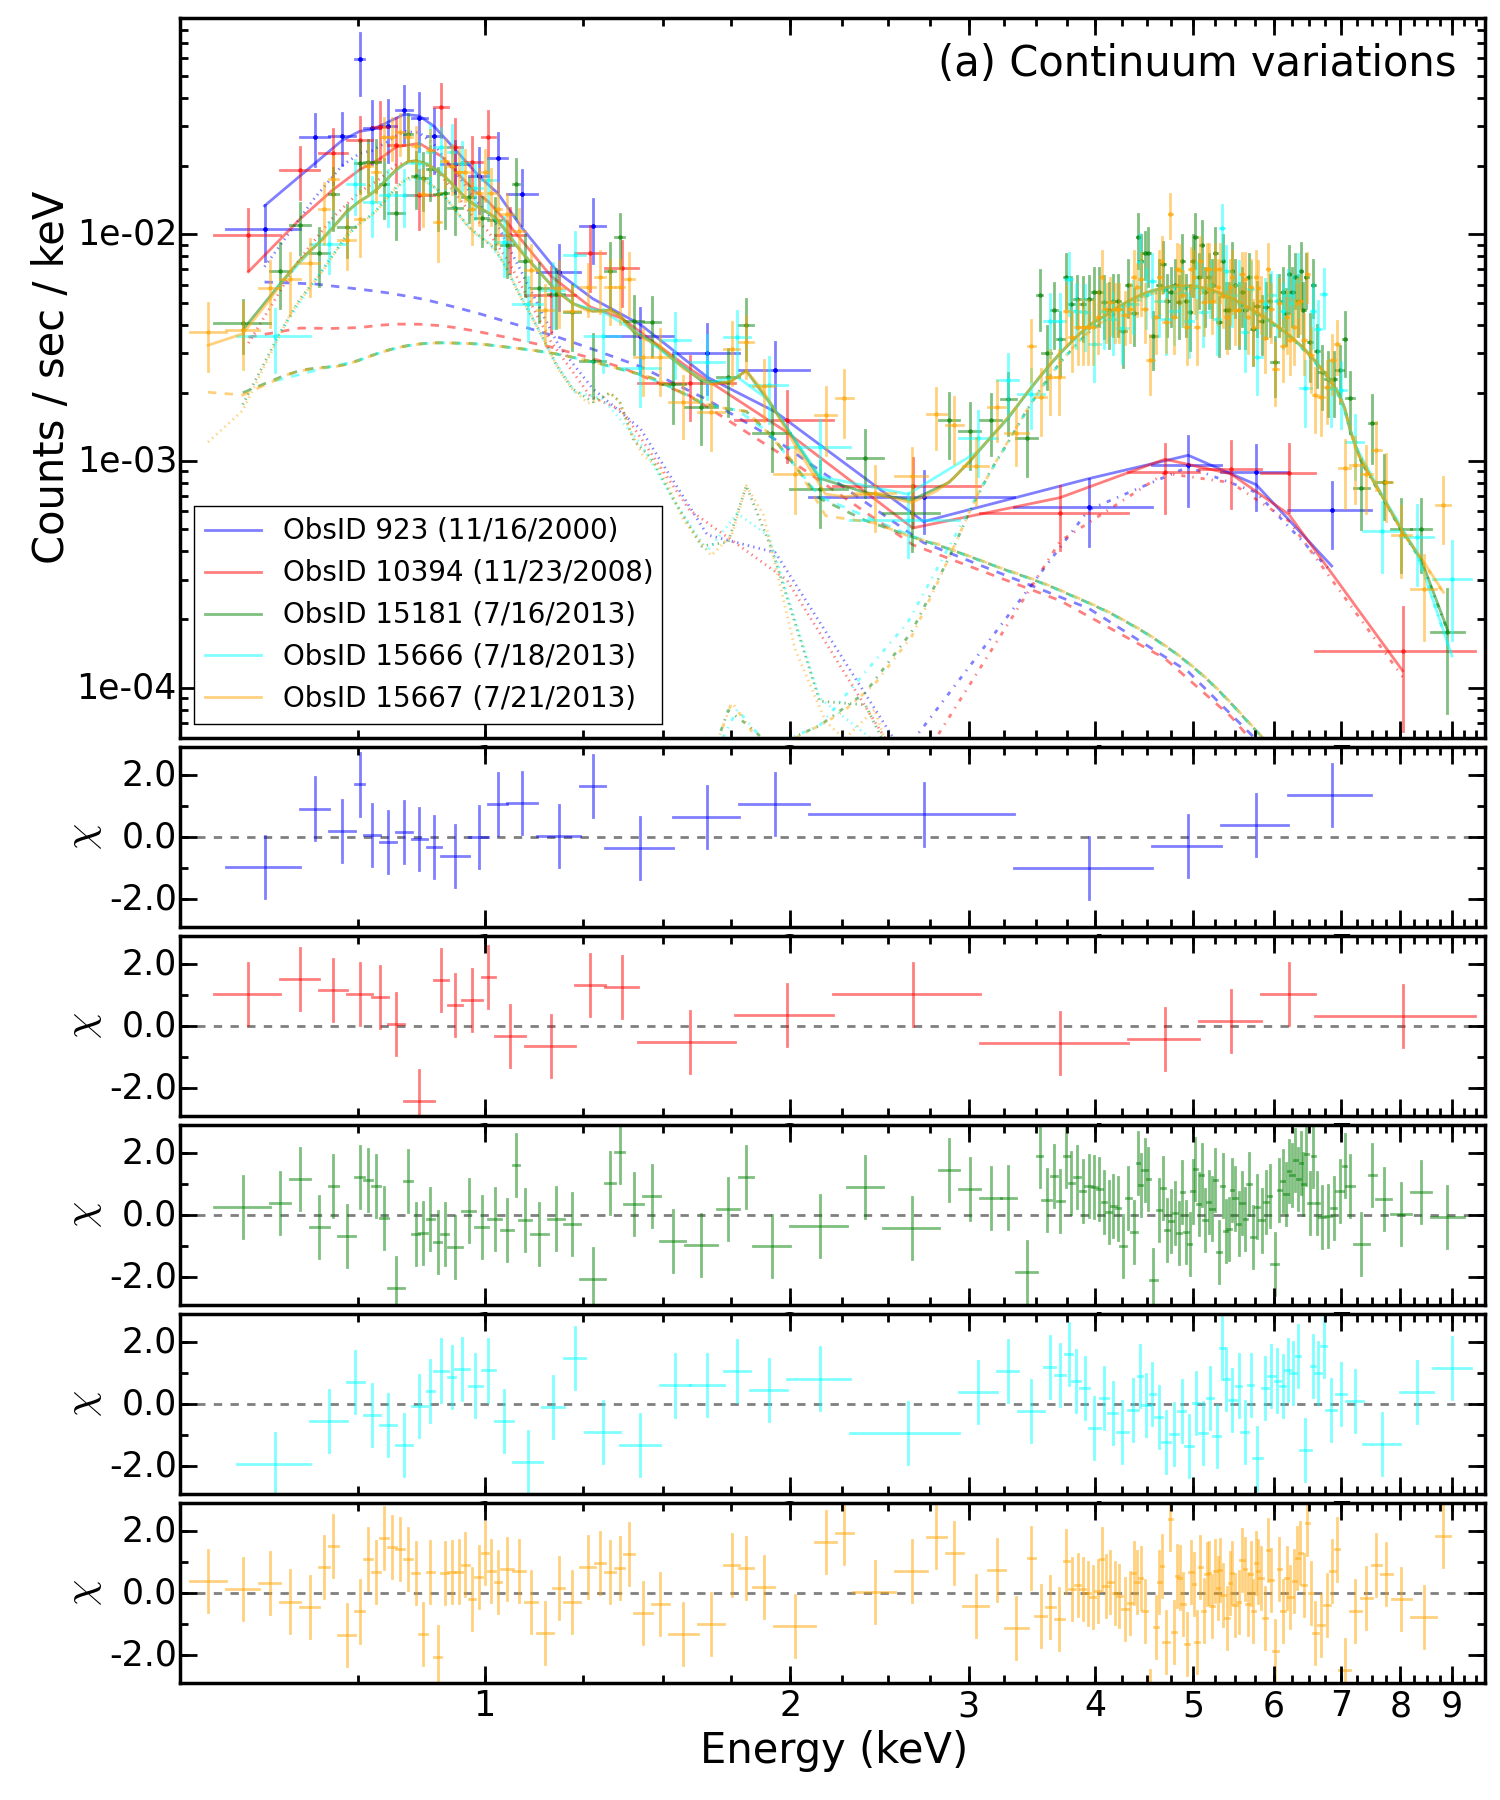
Fig. 2
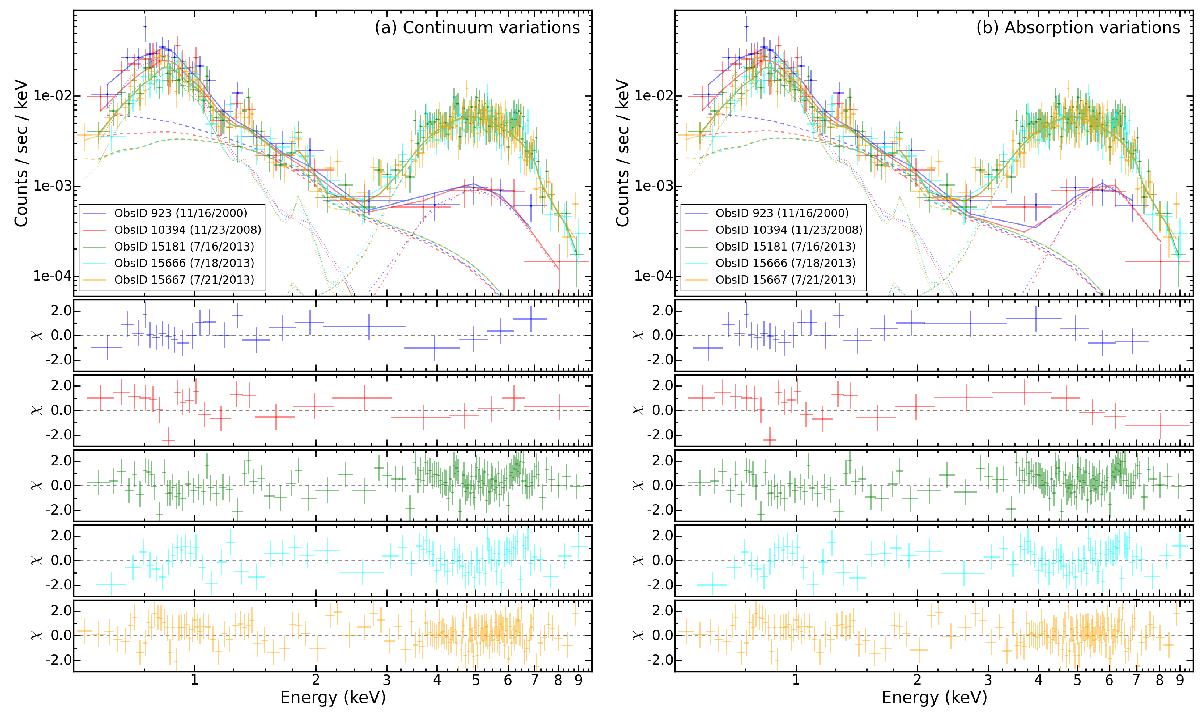
Simultaneous spectral fit to the five X-ray observations, including changes in a) the intrinsic continuum flux (left) and in b) the absorber in the line of sight (right). The top panel for each of them shows the spectral fitting for all the observations with different colours (see legend). The thermal, scattering, and intrinsic continuum components are also shown with dotted, dashed, and dot-dashed lines, respectively. The five panels below show the residuals for each of the observations separately.
Current usage metrics show cumulative count of Article Views (full-text article views including HTML views, PDF and ePub downloads, according to the available data) and Abstracts Views on Vision4Press platform.
Data correspond to usage on the plateform after 2015. The current usage metrics is available 48-96 hours after online publication and is updated daily on week days.
Initial download of the metrics may take a while.