Fig. 3
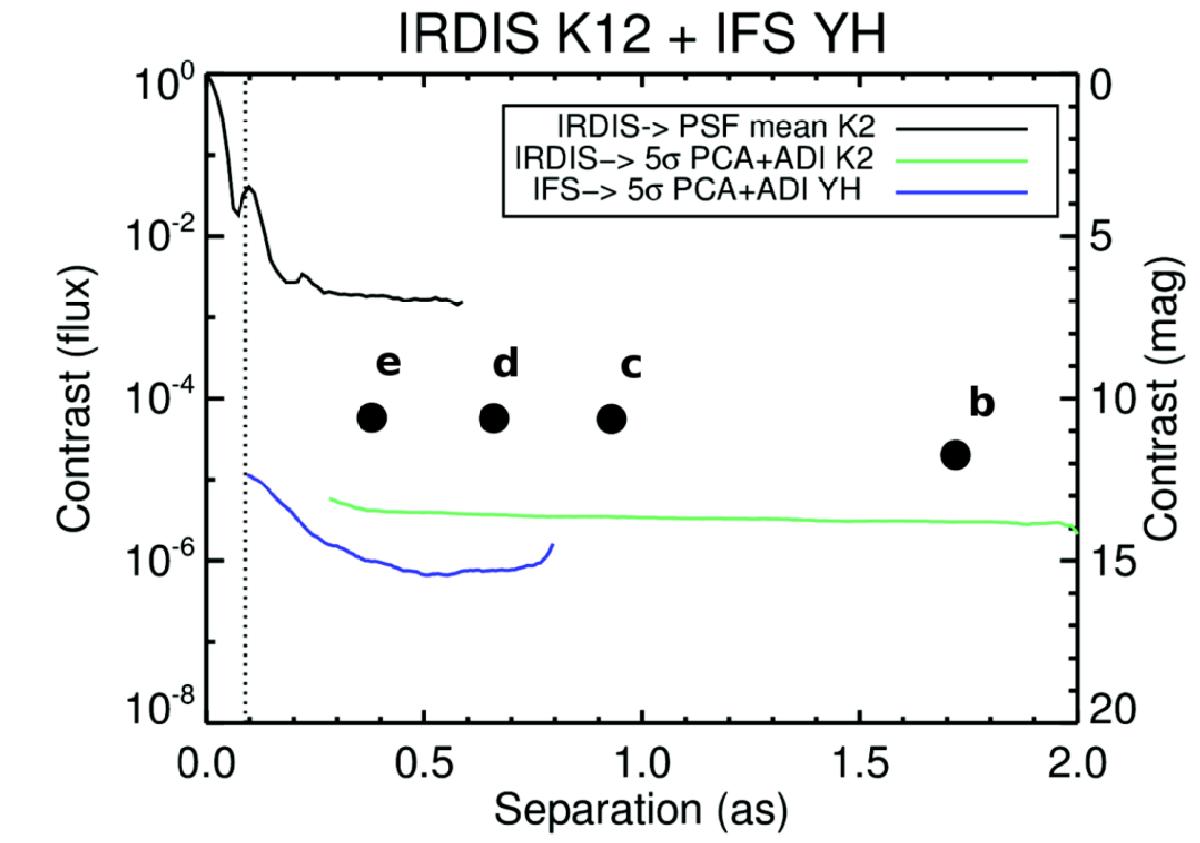
Contrastand off-axis PSFs curves for the IRDIFS_EXT data set. The 5σ contrast for the two instruments are plotted as a function of the angular separation. The off-axis PSF of the star is represented as a black continuous line. Planets around HR 8799 are also shown as photometric K2 points, the error bars are inside the dimension of the dots. The dotted vertical line indicates the coronagraph IWA.
Current usage metrics show cumulative count of Article Views (full-text article views including HTML views, PDF and ePub downloads, according to the available data) and Abstracts Views on Vision4Press platform.
Data correspond to usage on the plateform after 2015. The current usage metrics is available 48-96 hours after online publication and is updated daily on week days.
Initial download of the metrics may take a while.