Fig. 10
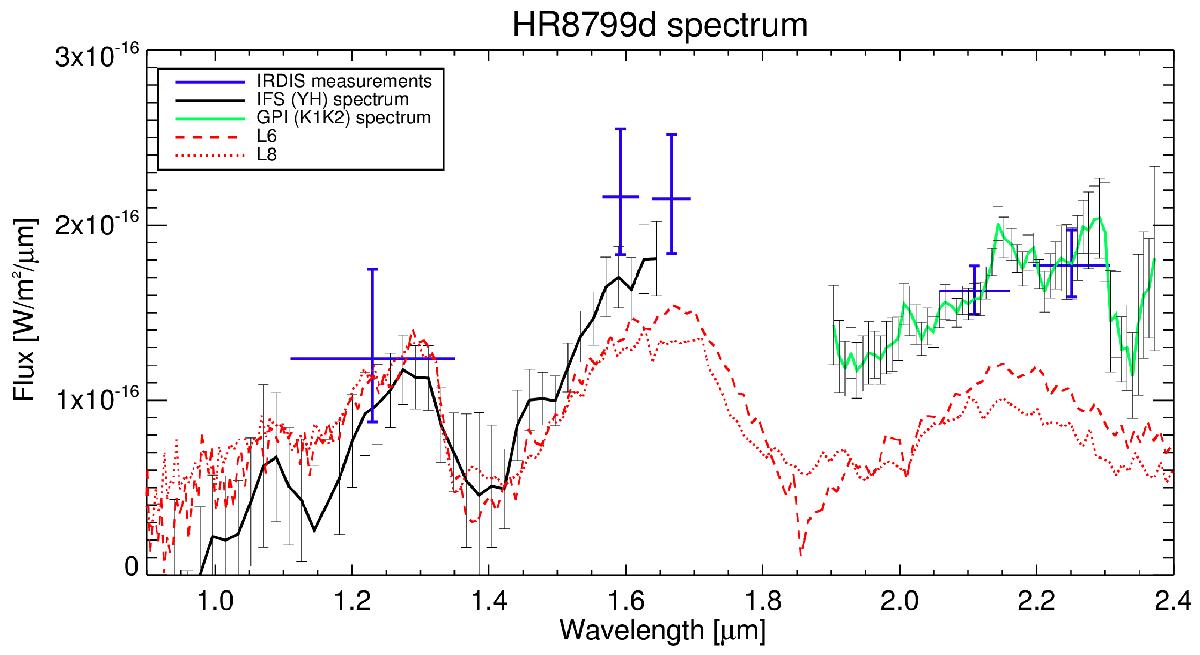
Spectrum of planet d as extracted from IFS data. IRDIS photometric points are overplotted. The GPI spectrum is also included in the plot. Comparison with a L6-L8 isolated brown dwarf shows a mismatch at K-band wavelengths.There is a slight mismatch between IRDIS and IFS measurements, as we normalized separately the flux of the two detectors with the corresponding PSF, the offset could be induced by another variable.
Current usage metrics show cumulative count of Article Views (full-text article views including HTML views, PDF and ePub downloads, according to the available data) and Abstracts Views on Vision4Press platform.
Data correspond to usage on the plateform after 2015. The current usage metrics is available 48-96 hours after online publication and is updated daily on week days.
Initial download of the metrics may take a while.