Fig. 6
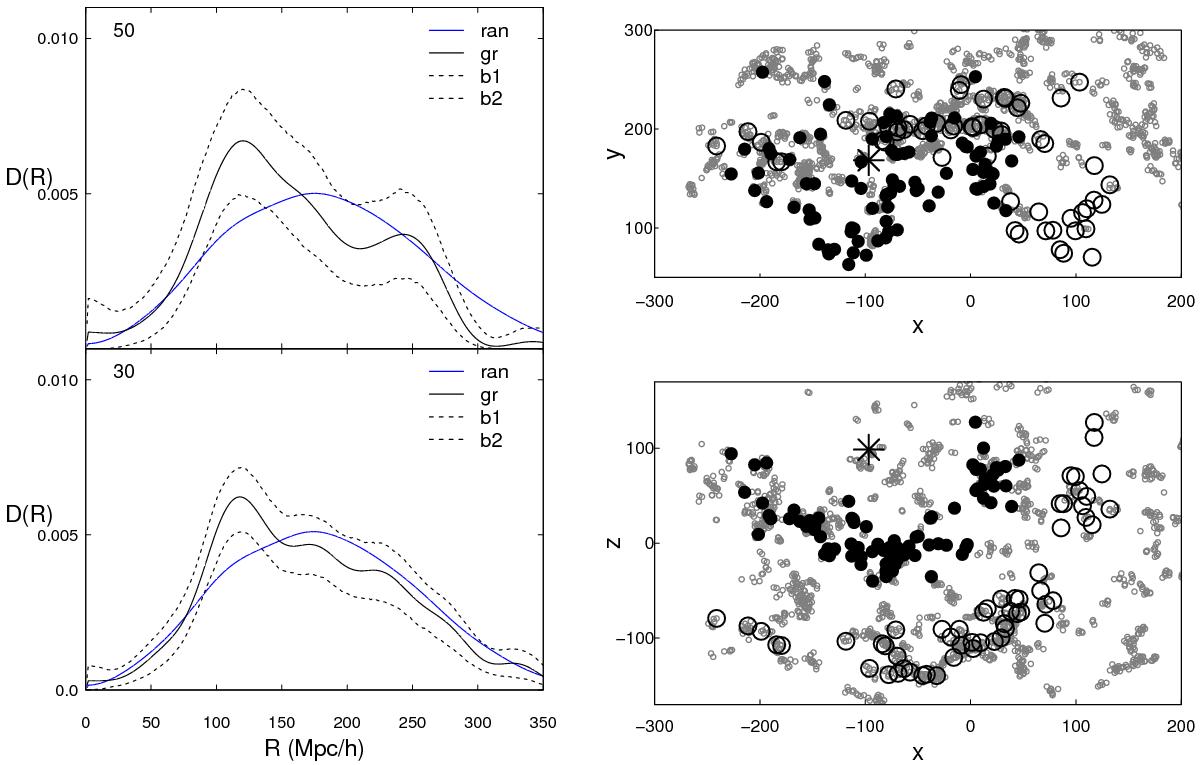
Distance distribution between cluster Gr50647 and other groups and clusters of different richness (left panels) and the distribution of groups with at least four galaxies in Cartesian coordinates (right panels). The richness limits of groups and clusters are given in the left panels, gr stands for group distributions, ran for the random samples, and b1 and b2 denote the upper and lower 95% bootstrap confidence limits for the group distributions. In the right panels grey empty circles show groups with at least four member galaxies. Black filled circles denote clusters with Ngal ≥ 30 in a distance interval of 90 h-1 Mpc ≤ D ≤ 140 h-1 Mpc from Gr50647, and black empty circles those with Ngal ≥ 30 in a distance interval of 200 h-1 Mpc ≤ D ≤ 250 h-1 Mpc from Gr50647. The star denotes the location of Gr50647. The positions of the maxima are 119 and 242 h-1 Mpc (upper left panel, Ngal ≥ 50), and 117 and 219 h-1 Mpc (lower left panel, Ngal ≥ 30).
Current usage metrics show cumulative count of Article Views (full-text article views including HTML views, PDF and ePub downloads, according to the available data) and Abstracts Views on Vision4Press platform.
Data correspond to usage on the plateform after 2015. The current usage metrics is available 48-96 hours after online publication and is updated daily on week days.
Initial download of the metrics may take a while.