Fig. 4
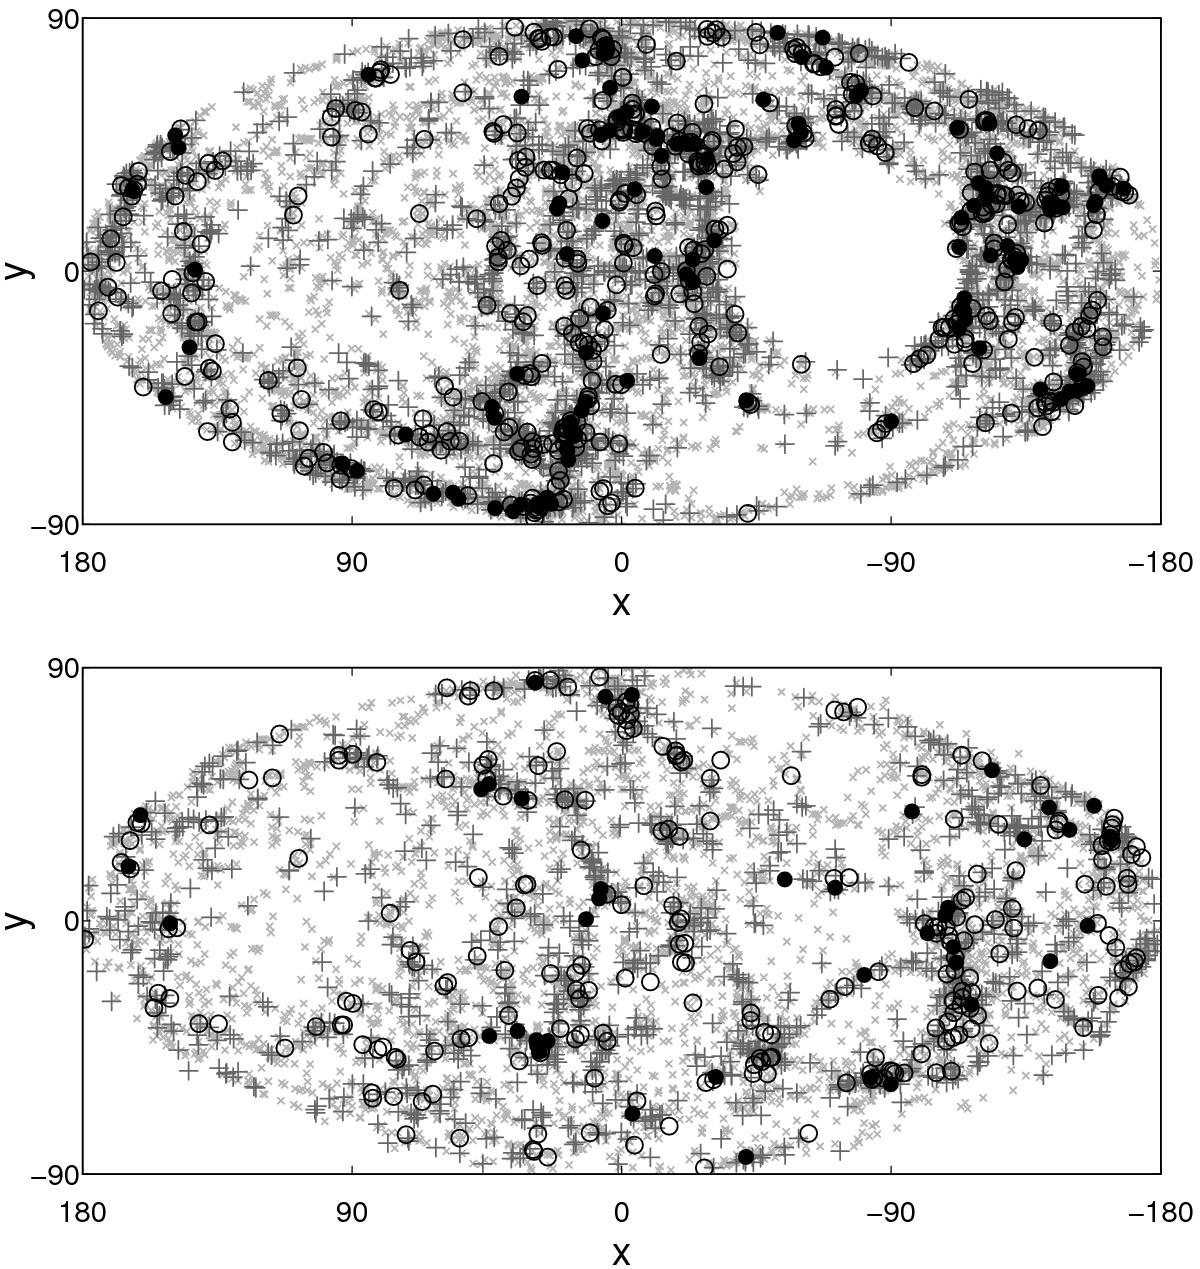
Sky distribution of galaxy groups around cluster A1795. X and Y are sky coordinates in a Hammer-Aitoff projection (Martínez & Saar 2002). Black filled circles denote clusters with Ngal ≥ 30, black empty circles those with 10 ≥ Ngal< 30, grey crosses those with 4 ≥ Ngal< 10, and grey dots show poor groups with only two or three member galaxies. Upper panel: groups and clusters in a distance interval of 90−130 h-1 Mpc, lower panel: in a distance interval of 50−90 h-1 Mpc. The void in the upper panel is due to the boundary effects.
Current usage metrics show cumulative count of Article Views (full-text article views including HTML views, PDF and ePub downloads, according to the available data) and Abstracts Views on Vision4Press platform.
Data correspond to usage on the plateform after 2015. The current usage metrics is available 48-96 hours after online publication and is updated daily on week days.
Initial download of the metrics may take a while.