Fig. 10
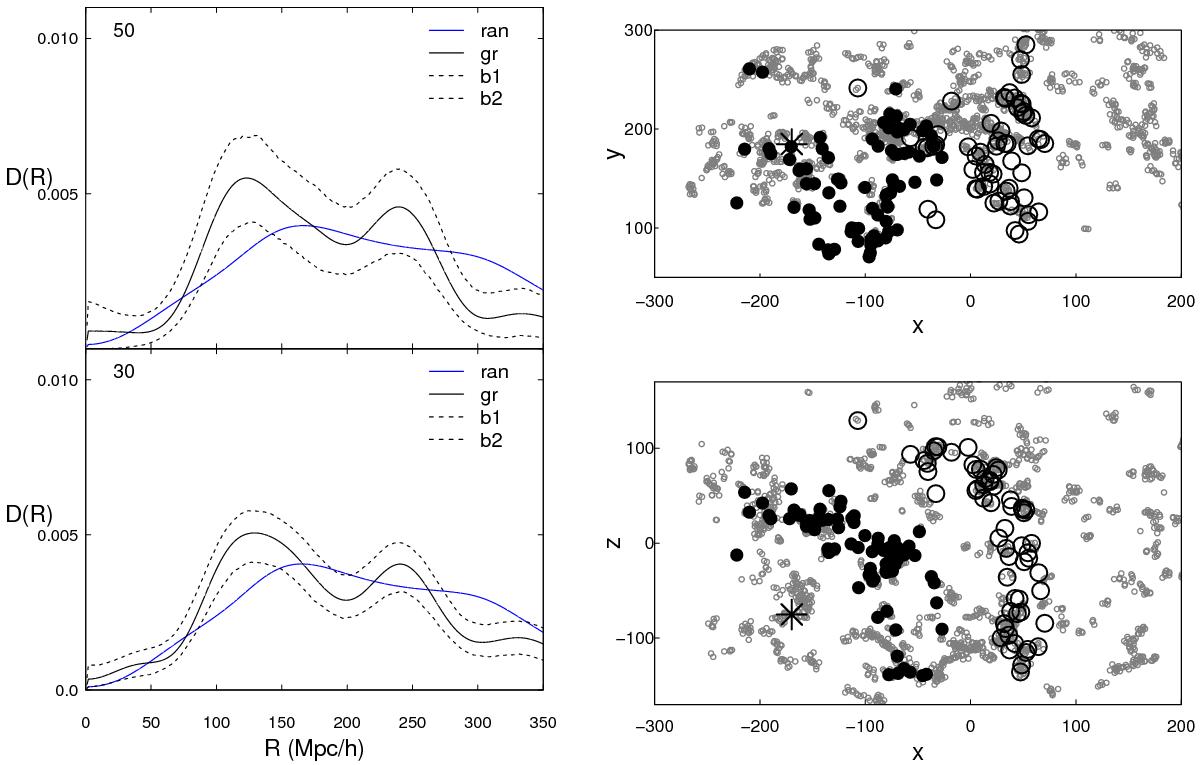
Distance distribution between cluster Gr34513 (A2020) and other groups and clusters of different richness (left panels) and the distribution of groups with at least four galaxies in Cartesian coordinates (right panels). Notations and details are the same as in Fig. 6. The maxima are located at 122 and 239 h-1 Mpc (upper left panel, Ngal ≥ 50), and 128 and 240 h-1 Mpc (lower left panel, Ngal ≥ 30).
Current usage metrics show cumulative count of Article Views (full-text article views including HTML views, PDF and ePub downloads, according to the available data) and Abstracts Views on Vision4Press platform.
Data correspond to usage on the plateform after 2015. The current usage metrics is available 48-96 hours after online publication and is updated daily on week days.
Initial download of the metrics may take a while.