| Issue |
A&A
Volume 587, March 2016
|
|
|---|---|---|
| Article Number | A93 | |
| Number of page(s) | 15 | |
| Section | Catalogs and data | |
| DOI | https://doi.org/10.1051/0004-6361/201526709 | |
| Published online | 23 February 2016 | |
Search of MeV–GeV counterparts of TeV sources with AGILE in pointing mode⋆
1
INFN–Pavia, via Bassi 6, 27100
Pavia,
Italy
e-mail:
This email address is being protected from spambots. You need JavaScript enabled to view it.
2
ASI Science Data Center, via del Politecnico snc,
00133
Roma,
Italy
3
INAF–Osservatorio Astronomico di Roma,
via di Frascati 33, 00040
Monteporzio Catone, Roma,
Italy
4
INAF–Osservatorio Astronomico di Trieste, via G.B. Tiepolo
11, 34143
Trieste,
Italy
5
INFN–Trieste, Padriciano 99, 34012
Trieste,
Italy
6
INAF-IAPS Roma, via Fosso del Cavaliere 100,
00133
Roma,
Italy
7
Dip. di Fisica, Università “Tor Vergata”,
via della Ricerca Scientifica 1,
00133
Roma,
Italy
8
INAF–IASF Bologna, via Gobetti 101, 40129
Bologna,
Italy
9
School of Physics, University of the Witwatersrand,
Johannesburg Wits
2050, South
Africa
10
INAF–IASF Milano, via E. Bassini 15, 20133
Milano,
Italy
11
INFN–Roma Tor Vergata, via della Ricerca Scientifica
1, 00133
Roma,
Italy
12
INAF–IASF Palermo, via Ugo La Malfa 153,
90146
Palermo,
Italy
Received: 9 June 2015
Accepted: 2 December 2015
Abstract
Context. Known TeV sources detected by major Čerenkov telescopes are investigated to identify possible MeV-GeV γ-ray counterparts.
Aims. A systematic study of the known sources in the web-based TeVCat catalog has been performed to search for possible γ-ray counterparts on the AGILE data collected during the first period of operations in observing pointing mode.
Methods. For each TeV source, a search for a possible γ-ray counterpart that is based on a multi-source maximum likelihood algorithm is performed on the AGILE data taken with the GRID instrument from July 2007 to October 2009.
Results. In the case of high-significance detection, the average γ-ray flux is estimated. For cases of low-significance detection the 95% confidence level (CL) flux upper limit is given. 52 TeV sources out of 152 (corresponding to ~34% of the analysed sample) show a significant excess in the AGILE data covering the pointing observation period.
Conclusions. This analysis found 26 new AGILE sources with respect to the AGILE reference catalogs, 15 of which are galactic, 7 are extragalactic and 4 are unidentified. Detailed tables with all available information on the analysed sources are presented.
Key words: catalogs / gamma rays: general
An interactive online version of the considered source list including all the analysis results is also available at the website http://www.asdc.asi.it/agiletevcat/
© ESO, 2016
1. Introduction
In the last years, the number of identified TeV sources has increased up to more than 100, thanks to the observations made by the new generation of ground-based Čerenkov telescopes HESS (Hinton 2004), MAGIC (Ferenc 2005) and VERITAS (Holder et al. 2006). These sources mainly belong to five classes: active galactic nuclei (AGN), supernova remnants (SNR), pulsar wind nebulae (PWN), X-rays binary systems (XRB), and pulsars (PSR). More than 80 TeV sources are galactic and a significant fraction of them (≳ 20%) do not show any evident counterpart and remain unidentified (UNID).
Multi-wavelength deep observations of the regions near the TeV sources are needed to identify the possible counterparts of the UNID, as well as to understand the emission mechanisms of the TeV γ-rays.
Following previous studies on the positional and spectral connection of GeV to TeV γ-ray sources performed on EGRET and Fermi-LAT data (Funk et al. 2008, 2013; Abdo et al. 2009; Acero et al. 2013), this paper reports the results of the search for γ-ray emission from known and unidentified TeV sources, using the data collected by AGILE in pointing mode in the energy range above 100 MeV.
This search is particularly relevant, as demonstrated by previous studies, because the two adjacent energy ranges probe different regions of the source spectra. Preliminary results have been previously presented (Rappoldi et al. 2011; Longo et al. 2011).
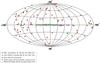 |
Fig. 1 Aitoff projection in Galactic coordinates of the TeV source positions, as extracted from the online TeVCat (“default catalog” and “newly announced” samples, June 2015; Wakely & Horan). |
2. The TeV source catalog
The analysis described in this paper has been applied to a reference sample of TeV sources extracted from the online TeVCat catalog1. This online catalog is continuously updated with new sources detected by TeV experiments, and for each source it provides many parameters such as coordinates, source type, flux, and estimated distance (when available).
At the time of writing (June 2015), the TeVCat catalog contains a total of 183 TeV sources: 129 of those are flagged as “default catalog” and have been published on refereed journals, 32 are flagged as “newly announced” (see also Fig. 1), ten are flagged as “other sources” and 12 are flagged as “sources candidates”. The analysis described here was performed on a subset of 152 TeV sources, both galactic and extragalactic, consisting of 120 sources of the “default catalog”, plus 32 “newly announced” sources. The following criteria were adopted to define the input sample. Three “extended regions”, which already include a compact TeV source, were excluded: the Galactic Centre Ridge (including HESS J1745-290 and SNR G 0.9+0.1), Boomerang PWN (including SNR G 106.3+2.7) and Milagro Diffuse (including MGRO J2019+37). The TeV sources SN 1006 SW and NE, HESS J1018-589 A and B as well as HESS J1800-240 A and B, were considered as single candidate γ-ray sources located, respectively, at the centre of the SNR 1006 shell, and at the centroid positions of HESS J1018-589 and HESS J1800-240. The two TeV sources ARGO J2031+4157 and MGRO J2031+41 were not included since they are both associated with TeV J2032+415 in the TeVCat. Moreover, the detection of the pulsed emission at TeV energies from the Crab and Vela Pulsar has not been considered in the sample since the timing analysis of pulsars is out of the scope of this paper.
Each sky position and extension of the TeV sources in the selected TeVCat sample has been carefully reviewed using published data. A new interactive web page of the catalog of TeV sources, including this coordinate revision and giving public access to light curves and spectra, is now available at the ASI Science Data Center (ASDC; Carosi et al. in press 2015)2.
When available, the best-fit position of the TeV excess has been used as starting input position for the AGILE data analysis. Otherwise, the position of the optical/radio known counterpart has been used. The error region on each TeV source position has been calculated by quadratically summing the statistical uncertainties on the position coordinates that were obtained from the 2D-Gaussian fit of the TeV excess, and the systematic uncertainties on the instrument pointing (when available in the literature).
3. The AGILE satellite
AGILE (Tavani et al. 2009) is an Italian Space Agency (ASI) small scientific mission for high-energy astrophysics launched on April 23, 2007 from the Indian base of Sriharikota in an equatorial orbit optimised for low particle background, with a very small inclination angle (~2.5°) and initial altitude of about 550 km.
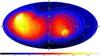 |
Fig. 2 Total AGILE exposure map during the first ~two years of operations (July 2007–October 2009). The exposure values are expressed in [cm2 Ms]. The mean, maximum and minimum exposures attained correspond to values of about 2250, 6800, and 60 cm2 Ms, respectively. |
The analysis has been performed using the data collected by the main AGILE instrument, the Gamma-Ray Imaging Detector (GRID). The AGILE-GRID is sensitive in the energy range 30 MeV−50 GeV and consists of a silicon-tungsten tracker, a caesium iodide mini-calorimeter, and an anticoincidence system made up of segmented plastic scintillators. The use of the silicon strip technology allows to have good performance for the γ-ray GRID imager, approximately a small cube of ~60 cm size, which achieves an effective area of approximately 500 cm2 at several hundreds MeV, an angular resolution (at 68% containment radius) of about 4.3° at 100 MeV, decreasing below 1° for energies above 1 GeV (Chen et al. 2013), an unprecedentedly large field of view (FOV) of about ~2.5 sr, as well as accurate timing, positional and attitude information (source location accuracy 5′−10′ for intense sources with S/N ≳ 10).
4. AGILE data set
During its first period of data taking (about two years) the AGILE satellite was operated in “pointing observing mode”, and the corresponding AGILE data are divided into observation blocks (OBs). Each AGILE OB consists of long exposures, which mostly range from a few days to about thirty days, with the pointing direction drifting ~1° per day with respect to the initial boresight direction to match solar panel illumination constraints.
The analysed AGILE data set covers the period from July 9, 2007 (beginning of the science verification phase) to October 18, 2009, corresponding to 96 OBs (not including the first five OBs of the Commissioning). During this period, following the main scientific program of the AGILE mission, the satellite was mainly pointed to observe two regions near the Galactic plane, around l = 90° and l = 270° longitude values, as shown by the total exposure map in Fig. 2. Clearly, this observation strategy mainly focused on the Galactic plane was not optimal for detecting extragalactic TeV sources.
5. Data analysis procedure
An iterative automated procedure has been developed to analyse the entire pointing AGILE data set described in Sect. 4, searching for possible γ-ray excesses correlated to the TeV sources. For each TeV source in the reference sample that is defined in Sect. 2, this procedure is divided in two main parts.
5.1. Map creation
The first part consists in the creation of the maps of counts, exposure and diffuse γ-ray background based on the model described in (Giuliani et al. 2004), updated together with the new GRID calibrations, which are centred at the TeV source position, over the full AGILE pointed observation period. These maps are in Galactic coordinates (l, b), ARC projection, with a size of 40° × 40° divided into bins of 0.1° × 0.1°, and they have been produced using the latest official AGILE scientific analysis software (Chen et al. 2011) – available at ASDC – with the following parameters:
-
data archive: ASDCSTDe
-
initial time: MJD (TT) = 54 290.5 (MET=111067134 s)3
-
final time: MJD (TT) = 55 122.5 (MET=182951934 s)
-
energy range: 100 MeV ÷ 50 GeV
-
software release: BUILD21
-
event filter: FM3.119
-
response matrices: I0023.
The event filter is the algorithm that processes the GRID raw data and reconstructs the energy and direction of the incident γ-ray in the GRID reference system. The event filter used in this analysis (FM3.119) represents the most updated reconstruction algorithm, which provides a good trade-off between FoV, effective area, and background rejection (Chen et al. 2011, 2013). Maps were generated for energies E> 100 MeV, including all events collected up to 60° off-axis. The South Atlantic Anomaly data were excluded and, to eliminate the Earth albedo contamination, events with reconstructed directions with respect to the satellite-Earth vector that were smaller than 85° were also rejected.
5.2. Source detection
The next part of the automatic procedure consists in verifying if, around the input TeV position, it is possible to detect the presence of a significant γ-ray source and, if so, to try to locate the best position of the γ-ray excess.
The source detection is performed by means of a multi-source maximum likelihood estimator (MLE) algorithm that estimates the photon counts and the position of the TeV source, the expected contribution given by the background components (modelled as a superposition of a Galactic diffuse emission background and an isotropic component), all the known AGILE γ-ray sources within the region of analysis, also taking into account the instrument response function.
In particular, the MLE analysis was performed taking into account all the known γ-ray sources detected by AGILE at the time of the analysis, consisting of a set of 65 sources, which were obtained by combining the 54 sources of the updated list of AGILE bright sources (1AGLR; Verrecchia et al. 2013), plus 11 sources not bright enough to be detected over the short OB time scales of the 1AGLR analysis: i.e. eight 1AGL sources from the first AGILE high confidence catalog (Pittori et al. 2009) and two AGL sources in the Carina region (see also Tables 2 and 3 of 1AGLR paper), plus one additional AGL source from a detailed analysis of the Cygnus region (Bulgarelli et al. 2012b). All AGILE sources are assumed to be point-like with simple power-law spectra.
With the exception of bright sources (significance > 5), AGILE data analysis may not be spectrally resolved owing to low statistics and, in general, a standard fixed spectral index value of −2.1 is adopted for the initial steps of the ML analysis. This assumption is motivated by the known spectral properties of the majority of the γ-ray sources in the AGILE energy range, except for a few sources, as described in the 1AGLR. Timing analysis of pulsars was not performed in this paper, and the γ-ray emission that is detected in the search of counterparts to the TeV emission from PWN is, in general, due to the average (pulsar + nebula) γ-ray flux values.
The significance of a source detection is evaluated by the square root of the test statistic TS, defined as  (1)where ℒ0/ ℒ1 is the ratio between the maximum likelihood ℒ0 of the null hypothesis and the likelihood ℒ1 of the alternative hypothesis (presence of a point–like source under evaluation; Mattox et al. 1996; Bulgarelli et al. 2012a). For a large enough number of counts (N ≳ 20), TS is expected to behave as
  in the null hypothesis, and the significance of a source detection is given by
  .
.
The source detection algorithm is very flexible and can be used with a variety of parameters and options that allow us to refine the process of source detection and location. For example, both the position and the flux of the analysed source can be considered fixed or variable (starting from a defined initial value). Additionally, the coefficients of the Galactic background (diffuse emission and isotropic component) may in turn be kept fixed or treated as variable.
To get the best result for the position and flux estimation of the analysed sources, an iterative MLE analysis is performed, divided into the following steps:
-
Step 1: the aim of the first step is both to find an excess of γ-rays around the input TeV source position in the AGILE data and to estimate, by the minimisation algorithm, the best values of the γ-ray background model parameters (galactic and extragalactic isotropic contributions). The MLE analysis is performed allowing the source coordinates to vary within a distance ≤ 1° from the input TeV source position, taking all known AGILE sources in the region of analysis with a radius of 10° into account;
-
Step 2: in this step the γ-ray excess position is refined by fixing the Galactic background coefficients to the best values obtained from Step 1;
-
Step 3: this is the final step to estimate the flux and significance
 of the γ-ray source at the optimised position, which
results from Step 2, using updated Galactic background coefficients at the new
position;
of the γ-ray source at the optimised position, which
results from Step 2, using updated Galactic background coefficients at the new
position; -
Step 4: this step gives directly an estimation of the flux and significance
 of the γ-ray source, assuming a fixed position that is
coincident with that of the input TeV source. In this case the diffuse background
coefficients are estimated at the original input position.
of the γ-ray source, assuming a fixed position that is
coincident with that of the input TeV source. In this case the diffuse background
coefficients are estimated at the original input position.
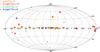 |
Fig. 3 Aitoff map in Galactic coordinates of all the detections according to the criteria specified in the text, corresponding to TeV sources that show a significant excess in the AGILE data. |
The possible shift in the γ-ray excess position may be due to several factors:
-
the rather poor angular resolution of the order of a few degrees in the MeV–GeV energy range4;
-
the AGILE reference catalog’s positioning errors (ranging from ~0.1° for very bright sources up to 0.7° for faint sources, at 95% CL);
-
extended TeV source (X);
-
the possible physical displacement between the TeV and the MeV–GeV emission regions.
In this paper an AGILE “detection” is in general defined by the condition  (2)which corresponds to a statistical significance of about 4 σ at the input TeV source position.
The search for optimised positions of the γ-ray excess gives results that are considered reliable when the MLE analysis (Steps 1−3) converges well within the allowed searching distance from the input position, and the significance of the detection is increased. In practice (see next section) this occurs when the following condition is satisfied:  (3)where dist is the angular distance between the position of the input TeV source and the candidate γ-ray source.
6. Results
In Table A.1, the complete list of all the TeV sources considered in this analysis is reported, showing the following relevant source parameters:
-
ID: identification number;
-
TeV source: TeV source name;
-
(l,b): position of the TeV source in Galactic coordinates;
-
TeV pos. err.: positional error of the input TeV source (derived as explained in Sect. 2);
-
Canonical name;
-
Type: type of TeV source counterpart, if already known from other wavelengths;
-
: estimate of the γ-ray statistical significance at Step 4;
-
: estimate of the γ-ray statistical significance at Step 3;
-
Flux4: estimate of the γ-ray flux (E> 100 MeV) and its 1σ statistical error in units of 10-7phcm-2s-1, for AGILE detected sources at the input TeV source position from Step 4;
-
UL4: AGILE γ-ray flux upper limit at 95% confidence level (CL) at the input TeV source position from Step 4;
-
EXT: TeV source extension.
In Table A.1, the γ-ray sources detected according to the criteria specified in Sect. 5.2 are shown in bold. For these sources the calculated flux value and the corresponding error is given, while for the sources not satisfying the detection requirement, the estimated 95% CL upper limit is reported.
In total, 52 TeV sources show a significant excess in the AGILE data that covers the pointed observation period, corresponding to 34% of the original sample. The Aitoff map in Galactic coordinates of all the detections is shown in Fig. 3.
Table A.3 groups all the sources detected with AGILE in this work (shown in bold in the previous table), and it includes the following columns:
-
ID: source identification number used in Table A.1
-
TeV source: TeV source name;
-
 : estimate of the γ-ray source statistical significance as result of the AGILE MLE analysis (upper part Step 3, lower part Step 4;
 -
(l,b): optimised peak position of the AGILE excess in Galactic coordinates (upper part);
-
Error: γ-ray source location error radius at 95% CL from Step 3 (statistical error only);
-
Flux: estimate of the γ-ray flux (E> 100 MeV) at the optimised peak position and its 1σ statistical error in units of 10-7phcm-2s-1;
-
Dist: distance of the γ-ray peak position from the input position of the TeV source;
-
AGILE association: already known AGILE source from the published 1AGL/1AGLR catalogs (Pittori et al. 2009; Verrecchia et al. 2013) within the error radius in the 7th column;
-
Fermi association: known Fermi-LAT source(s) associated to the TeV source, as described on 3FGL catalog (Acero et al. 2015);
-
Analysis flag (see below).
Table A.3 is split into two sections: the upper part reports the results of the MLE analysis Step 3 for all the sources that satisfy the condition in Eq. (3). The lower part includes the detected sources that satisfy the condition in Eq. (2) but not Eq. (3), for which the Step 3 automatic analysis is not reliable. For this reason, the values of and flux shown in this part of the table are those found at Step 4 at the input TeV positions. There are few exceptions to these criteria which are described in the table footnotes. For all of the 19 sources in the lower section of Table A.3, although the MLE analysis result at fixed input position is significant, the tentative optimisation of the location of the γ-ray peak flux fails. In these cases the region of analysis may not yet be well modelled, and a refined MLE analysis should be performed after the release of a new AGILE catalog (Bulgarelli et al., in prep.).
As reported in the 8th column of Table A.3, 26 spatial associations of the detected TeV sources with already known AGILE sources from the 1AGL/1AGLR catalogs are found within the 95% CL error radius (7th column; Pittori et al. 2009; Verrecchia et al. 2013). Among these sources, 15 are galactic, six are extragalactic and five are unassociated. As reported in the 9th column, 46 spatial associations with known Fermi sources from the 3FGL catalog are found (we note that some TeV sources have more than one 3FGL association). Fermi counterparts that are officially associated to the corresponding TeV source in the 3FGL catalog may have flag P (for point-like sources) or E (for extended sources).
Column 10th of Table A.3 reports an analysis flag assigned to the AGILE detection according to the position and extent of the source location contour:
-
IN (Inside): the TeV source, including its extension (if any), is entirely within the AGILE contour (see an example in Fig. 4);
-
O (Overlapping): the AGILE contour at the 95% CL overlaps with the error circle and/or the extension of the TeV source (see Fig. 5);
-
E (External): the AGILE contour neither includes nor overlaps with the TeV source. Nevertheless, the AGILE peak position is within 0.6° from the TeV source position (see Fig. 6).
In this work, 26 new AGILE sources are found with respect to the AGILE reference catalogs, 15 of which are galactic, 7 are extragalactic and 4 are unidentified. Detailed statistics about the type of the detected source can be found in Table A.4.
Eight sources are detected by AGILE in this analysis with no Fermi 3FGL official association:
-
*
ID 88: TeV J1634-472 (HESS J1634-472)
-
–
ID 96: TeV J1713-382 (CTB 37B)
-
–
ID 103: TeV J1729-345 (HESS J1729-345)
-
–
ID 104: TeV J1732-347 (HESS J1731-347)
-
–
ID 105: TeV J1741-302 (HESS J1741-302)
-
*
ID 116: TeV J1813-178 (HESS J1813-178)
-
–
ID 133: TeV J1911+090 (W49B)
-
–
ID 134: TeV J1912+101 (HESS J1912+101)
two of which, indicated by asterisks, have counterparts in the already published AGILE catalogs, and do not represent new detections.
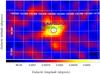 |
Fig. 4 Source detection in the position of TeV J0721+713. The signal is detected with |
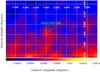 |
Fig. 5 Source detection in the position of TeV J1747-248. The signal is detected with |
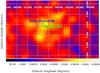 |
Fig. 6 Source detection in the position of TeV J2227+608. The signal is detected with |
6.1. Spectral analysis
Table A.3 shows the results of the spectral analysis performed on the most significant sources detected in this analysis. Only the 24 sources detected with a significance  (see Table A.3, upper part) and | b | < 30° have been considered.
For all considered sources, the AGILE spectral index shown in the fourth column of Table A.3 has been calculated generating exposure, counts and diffuse background maps over five energy bands: 100−200 MeV, 200−400 MeV, 400−1000 MeV, 1−3 GeV, and 3−50 GeV, under the assumption of a power-law energy distribution.
For comparison, the Fermi power-law spectral index of the 3FGL counterpart of the TeV source is also shown in the last column of the table5. AGILE and Fermi power-law spectral indices are also compared in Fig. 7. A quantitative comparison between Fermi and AGILE power-law spectral indices can be done adding quadratically the AGILE and Fermi power-law spectral index errors when available or relying only on the AGILE error. No systematic error is assumed. Based on these very conservative assumptions, the distribution of the pulls (difference between the AGILE and Fermi power-law spectral indices divided by their combined errors) shown in Fig. 8 may be significantly overestimated. Nevertheless, for most of the sources (19 out of 22), AGILE and Fermi power-law spectral indices agree within three σ.
As explained in Sect. 5.2, the analysis in this paper was performed taking into account all the known γ-ray sources detected by AGILE at the time of the analysis, and in general more than one 3FGL source may be within the 95% AGILE error circle (plus a suggested systematic error of 0.1°). In particular, in the TeV J1841-055 case – the one with the largest pull (red) – there are three 3FGL sources within the AGILE detection error circle. The TeV source has an extension of the order of 0.5 deg, and the AGILE spectral result was compared with the associated extended Fermi PWN 3FGL J1840.9-0532e. It is likely that the other two γ-ray sources (3FGL J1839.3-0552 and 3FGL J1838.9-0537) contribute to the AGILE-detected emission, both having softer power-law spectral indices.
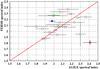 |
Fig. 7 Comparison between the spectral index evaluated for the most significant sources that were detected by AGILE, and the corresponding “power-law” spectral index reported by Fermi (22 sources). The horizontal bars represent the AGILE spectral index errors, the vertical bars represent the Fermi spectral index errors, when available. The coloured points refer to the sources highlighted in Fig. 8. |
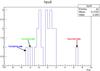 |
Fig. 8 Pull distribution of the difference between the AGILE and Fermi power-law spectral indices divided by their combined errors. The three sources with pull larger than three are shown. |
7. Conclusions and discussion
An analysis has been performed on a sample of 152 known TeV sources using the first two years of AGILE data with the purpose of detecting γ-ray emission that is associated with these TeV sources6.
A significant γ-ray excess in the AGILE data has been found for 52 input TeV sources, corresponding to ~34% of the analysed sample. In particular, 26 new AGILE sources have been found with respect to the AGILE reference catalogs, 15 of which are galactic, seven are extragalactic and four are unidentified.
Eight of the AGILE detected TeV sources (listed in Sect. 6) have no 3FGL official association and will be further investigated in a dedicated paper.
The difference between the two experiments in some cases may be due to a different response to softer spectral index sources with spectral energy distribution peaking in the 100−400 MeV energy range or to differences in the assumed background diffuse model. A new Fermi analysis using the recently delivered Pass 8 Data, which provides a significant increase in acceptance at lower energies may result in new Fermi associations. Furthermore according to the official Fermi collaboration association procedure, only counterparts which reach a posteriori probability of at least 80% are retained, and this does not mean that there is no 3FGL source within the error region.
The spatial association of a TeV source with an AGILE source may be due to chance. The probability of a serendipitous association may be estimated by evaluating the total sky coverage of all catalogued AGILE sources, which are defined by their 95% error radius, and then calculating the overall probability that each TeV source can overlap to any AGILE source, that is, the distance between a TeV source and an AGILE source is, by chance, smaller than the sum of their error circles (Funk et al. 2007). Because the density of both TeV and AGILE sources are strongly non-uniform, being much larger on the Galactic plane, this evaluation is performed separately on a narrow stripe along the Galactic plane7, defined by | b | ≤ 3°, and on all the rest of the sky map, defined by | b | > 3°. The number of serendipitous associations is found to be 0.82 for this type of band around the Galactic plane, whereas it is 0.08 for the other region. Therefore the chance coincidence should be  over the whole sky.
The analysis that we have accomplished and described in this paper concerns a nearly continuous data taking period of about two year, therefore the obtained fluxes (and corresponding detection significances) are the average values integrated over a rather long time. For this reason, some γ–sources that are characterised by high variability (for example W Comae (Verrecchia et al. 2008) and 4C +21.35 Bulgarelli et al. 2010; Striani et al. 2010; Verrecchia et al. 2014) have not been detected in this analysis (and similarly in Verrecchia et al. 2013), even if they have already been detected and analysed in other previous observations published by AGILE, which refers to shorter time periods in coincidence with their flares.
The majority of the AGILE detected sources are galactic. This might be a bias due the higher exposure of the Galactic plane during the pointing period, see Fig. 2.
From the Analysis flag reported in Table A.3, 13 AGILE detected sources in the Galactic plane are flagged as “overlapping” or “external” with the TeV emission region. This may indicate a possible displacement between the TeV and the GeV emission regions, as is the case for the IC443 SNR (Tavani et al. 2010).
http://tevcat.uchicago.edu/ (Wakely, S., and Horan, D.).
MET is the AGILE Mission Elapsed Time in seconds since 2004.0 UTC.
About 0.7° PSF HWHM at 400 MeV, corresponding to the AGILE effective area peak values (Sabatini et al. 2015).
The “power law index” reported in the 3FGL catalog (Acero et al. 2015) is given without error, and corresponds to the result of fitting the spectrum with a power-law function; it is equal to “spectral index” only when spectrum type is PowerLaw and in these cases errors are available.
An interactive online version of the source list including all the analysis results is also accessible at the ASDC website http://www.asdc.asi.it/agiletevcat/
The probability estimation is weakly dependent on the boundary used.
Acknowledgments
The authors would like to thank the Istituto Nazionale di Astrofisica, the Agenzia Spaziale Italiana, the Consorzio Interuniversitario per la Fisica Spaziale, and the Istituto Nazionale di Fisica Nucleare for their generous support of the AGILE mission and this research, including ASI contracts N. I/042/10/1 and I/028/12/0.
References
- Abdo, A. A., Ackermann, M., Ajello, M., et al. 2009, ApJ, 707, 1310 [NASA ADS] [CrossRef] [Google Scholar]
- Acero, F., Ackermann, M., Ajello, M., et al. 2013, ApJ, 773, 77 [CrossRef] [Google Scholar]
- Acero, F., Ackermann, M., Ajello, M., et al. 2015, ApJS, 218, 23 [Google Scholar]
- Bulgarelli, A., Gianotti, F., Trifoglio, M., et al. 2010, ATel, 2641, 1 [NASA ADS] [Google Scholar]
- Bulgarelli, A., Chen, A. W., Tavani, M., et al. 2012a, A&A, 540, A79 [NASA ADS] [CrossRef] [EDP Sciences] [Google Scholar]
- Bulgarelli, A., Tavani, M., Chen, A. W., et al. 2012b, A&A, 538, A63 [NASA ADS] [CrossRef] [EDP Sciences] [Google Scholar]
- Carosi, A., Lucarelli, F., & Antonelli, L. 2015, in Proc. 34th International Cosmic Ray Conference, The Hague, The Netherlands, in press [Google Scholar]
- Chen, A. W., Argan, A., Bulgarelli, A., et al. 2013, A&A, 558, A37 [NASA ADS] [CrossRef] [EDP Sciences] [Google Scholar]
- Chen, A. W., et al. 2011, GRID Scientific Analysis – USER MANUAL, http://agile.asdc.asi.it/public/AGILE_SW_5.0_SourceCode/ [Google Scholar]
- Ferenc, D. 2005, Nucl. Instrum. Methods A, 553, 274 [NASA ADS] [CrossRef] [Google Scholar]
- Funk, S., Reimer, O., Torres, D., & Hinton, J. A. 2007, in Proc., 30th International Cosmic Ray Conference, 2, 617 [Google Scholar]
- Funk, S., Reimer, O., Torres, D. F., & Hinton, J. A. 2008, ApJ, 679, 1299 [NASA ADS] [CrossRef] [Google Scholar]
- Funk, S., Hinton, J. A., & CTA Consortium. 2013, Astropart. Phys., 43, 348 [NASA ADS] [CrossRef] [Google Scholar]
- Giuliani, A., Chen, A. W., & Mereghetti, S. 2004, Mem. Soc. Astron. It. Supp., 5, 135 [Google Scholar]
- Hinton, J. 2004, New Astron. Rev., 48, 331 [NASA ADS] [CrossRef] [Google Scholar]
- Holder, J., Atkins, R. W., Badran, H. M., et al. 2006, Astropart. Phys., 25, 391 [NASA ADS] [CrossRef] [MathSciNet] [Google Scholar]
- Longo, F., Rappoldi, A., Lucarelli, F., et al. 2011, TeV sources analysis with AGILE, arXiv e-print [arXiv:1111.2039] [Google Scholar]
- Lucarelli, F., Pittori, C., Rappoldi, A., & Longo, F. 2011, in 32nd International Cosmic Ray Conference, Bejing, China, 7, 236 [Google Scholar]
- Mattox, J., Bertsch, D., Chiang, J., et al. 1996, ApJ, 461, 396 [NASA ADS] [CrossRef] [Google Scholar]
- Pellizzoni, A., Trois, A., Tavani, M., et al. 2010, Science, 327, 663 [NASA ADS] [CrossRef] [PubMed] [Google Scholar]
- Pittori, C., Verrecchia, F., Chen, A. W., et al. 2009, A&A, 506, 1563 [NASA ADS] [CrossRef] [EDP Sciences] [Google Scholar]
- Rappoldi, A., Longo, F., Argan, A., et al. 2011, Nucl. Instrum. Methods A, 630, 202 [NASA ADS] [CrossRef] [Google Scholar]
- Sabatini, S., Donnarumma, I., Tavani, M., et al. 2015, ApJ, 809, 60 [NASA ADS] [CrossRef] [Google Scholar]
- Striani, E., Verrecchia, F., Donnarumma, I., et al. 2010, ATel, 2686, 1 [NASA ADS] [Google Scholar]
- Tavani, M., Barbiellini, G., Argan, A., et al. 2009, A&A, 502, 995 [NASA ADS] [CrossRef] [EDP Sciences] [Google Scholar]
- Tavani, M., Giuliani, A., Chen, A. W., et al. 2010, ApJ, 710, L151 [NASA ADS] [CrossRef] [Google Scholar]
- Verrecchia, F., Gasparrini, D., Cutini, S., et al. 2008, ATel, 1582, 1 [NASA ADS] [Google Scholar]
- Verrecchia, F., Pittori, C., Chen, A. W., et al. 2013, A&A, 558, A137 [NASA ADS] [CrossRef] [EDP Sciences] [Google Scholar]
- Verrecchia, F., Lucarelli, F., Pittori, C., et al. 2014, ATel, 6733, 1 [NASA ADS] [Google Scholar]
Appendix A: Additional tables
152 TeV sources considered in this analysis.
Results for all the sources detected with AGILE in this work, according to the criteria described in the text.
Results of the spectral analysis of the most significant sources detected with AGILE in this analysis.
Statistics about the sources detected by AGILE in this work, grouped by source type classification.
All Tables
Results for all the sources detected with AGILE in this work, according to the criteria described in the text.
Results of the spectral analysis of the most significant sources detected with AGILE in this analysis.
Statistics about the sources detected by AGILE in this work, grouped by source type classification.
All Figures
|
Fig. 1 Aitoff projection in Galactic coordinates of the TeV source positions, as extracted from the online TeVCat (“default catalog” and “newly announced” samples, June 2015; Wakely & Horan). |
| In the text | |
|
Fig. 2 Total AGILE exposure map during the first ~two years of operations (July 2007–October 2009). The exposure values are expressed in [cm2 Ms]. The mean, maximum and minimum exposures attained correspond to values of about 2250, 6800, and 60 cm2 Ms, respectively. |
| In the text | |
|
Fig. 3 Aitoff map in Galactic coordinates of all the detections according to the criteria specified in the text, corresponding to TeV sources that show a significant excess in the AGILE data. |
| In the text | |
|
Fig. 4 Source detection in the position of TeV J0721+713. The signal is detected with |
| In the text | |
|
Fig. 5 Source detection in the position of TeV J1747-248. The signal is detected with |
| In the text | |
|
Fig. 6 Source detection in the position of TeV J2227+608. The signal is detected with |
| In the text | |
|
Fig. 7 Comparison between the spectral index evaluated for the most significant sources that were detected by AGILE, and the corresponding “power-law” spectral index reported by Fermi (22 sources). The horizontal bars represent the AGILE spectral index errors, the vertical bars represent the Fermi spectral index errors, when available. The coloured points refer to the sources highlighted in Fig. 8. |
| In the text | |
|
Fig. 8 Pull distribution of the difference between the AGILE and Fermi power-law spectral indices divided by their combined errors. The three sources with pull larger than three are shown. |
| In the text | |
Current usage metrics show cumulative count of Article Views (full-text article views including HTML views, PDF and ePub downloads, according to the available data) and Abstracts Views on Vision4Press platform.
Data correspond to usage on the plateform after 2015. The current usage metrics is available 48-96 hours after online publication and is updated daily on week days.
Initial download of the metrics may take a while.