Fig. 9
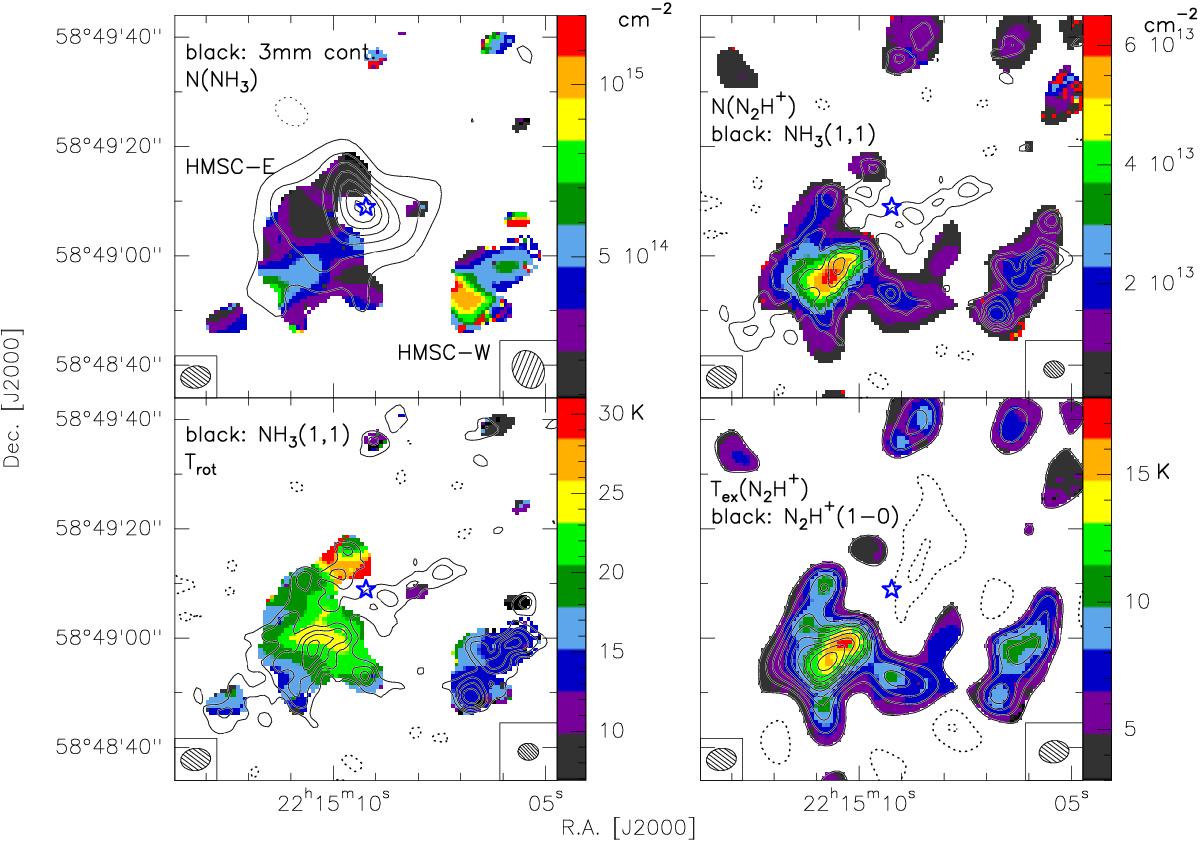
Left: NH3 column density map (top) and rotational temperature map overlaid with 3 mm continuum and NH3(1, 1) integrated intensity contours, respectively. Right: the N2H+ column density map overlaid with NH3(1, 1) integrated intensity contours (top), and N2H+(1–0) excitation temperature map overlaid with N2H+(1–0) integrated intensity contours. The 3 mm continuum contours start at 3σ in steps of 4σ. All the other contour levels parameters are the same as in Fig. 5. The synthesized beam of the temperature and column density map is shown in the bottom left corner of each panel, and the synthesized beam of the contour map is shown in the bottom right corner of each panel.
Current usage metrics show cumulative count of Article Views (full-text article views including HTML views, PDF and ePub downloads, according to the available data) and Abstracts Views on Vision4Press platform.
Data correspond to usage on the plateform after 2015. The current usage metrics is available 48-96 hours after online publication and is updated daily on week days.
Initial download of the metrics may take a while.