Fig. 8
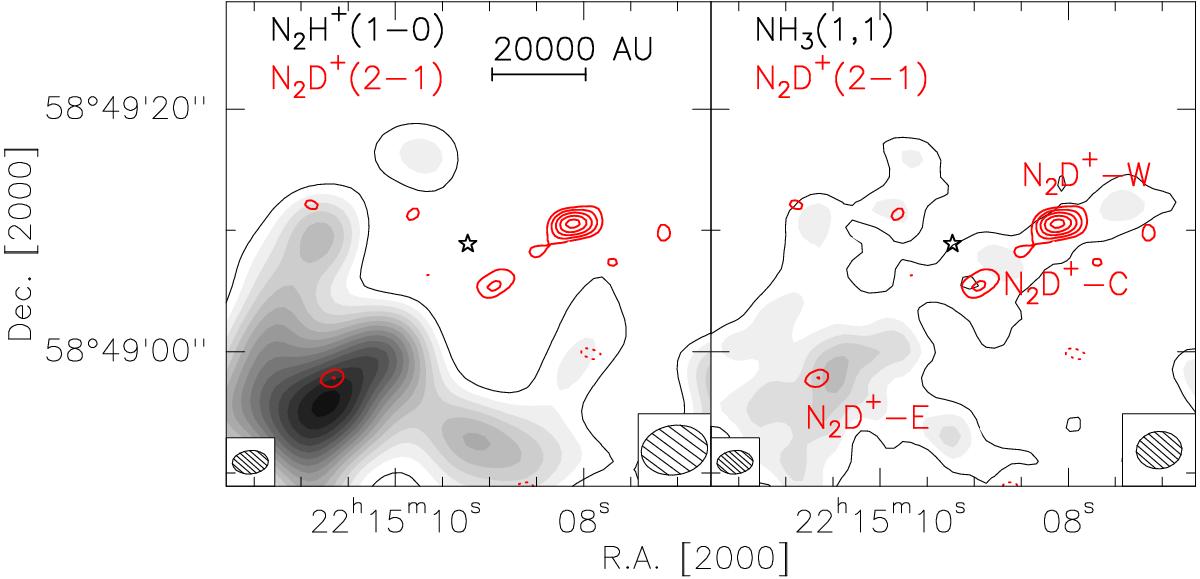
N2D+(2–1) integrated intensity map overlaid on the N2H+(1–0) and NH3(1, 1) integrated intensity maps. The contour level parameters of N2D+(2–1) integrated intensity map are the same as in Fig. 7. The thin black contour in each panel indicates the 3σ level of the N2H+(1–0) and NH3(1, 1) integrated intensity emission. The σ values and integrated velocity range are the same as in Figs. 7 and 5, respectively. The star marks the UCHii region. The dotted contours are the negative features due to the missing flux with the same contour levels as the positive ones in each panel. The synthesized beam of N2D+(2–1) is shown in the bottom left corner of each panel, and the one of N2H+(1–0) and NH3(1, 1) is shown in the bottom right corner of respective panel.
Current usage metrics show cumulative count of Article Views (full-text article views including HTML views, PDF and ePub downloads, according to the available data) and Abstracts Views on Vision4Press platform.
Data correspond to usage on the plateform after 2015. The current usage metrics is available 48-96 hours after online publication and is updated daily on week days.
Initial download of the metrics may take a while.